

Question: The graph below is Mendork's production possibility curve for the only two goods that it produces-quirks and quarks. 800 Quantity of Quarks B 888 100
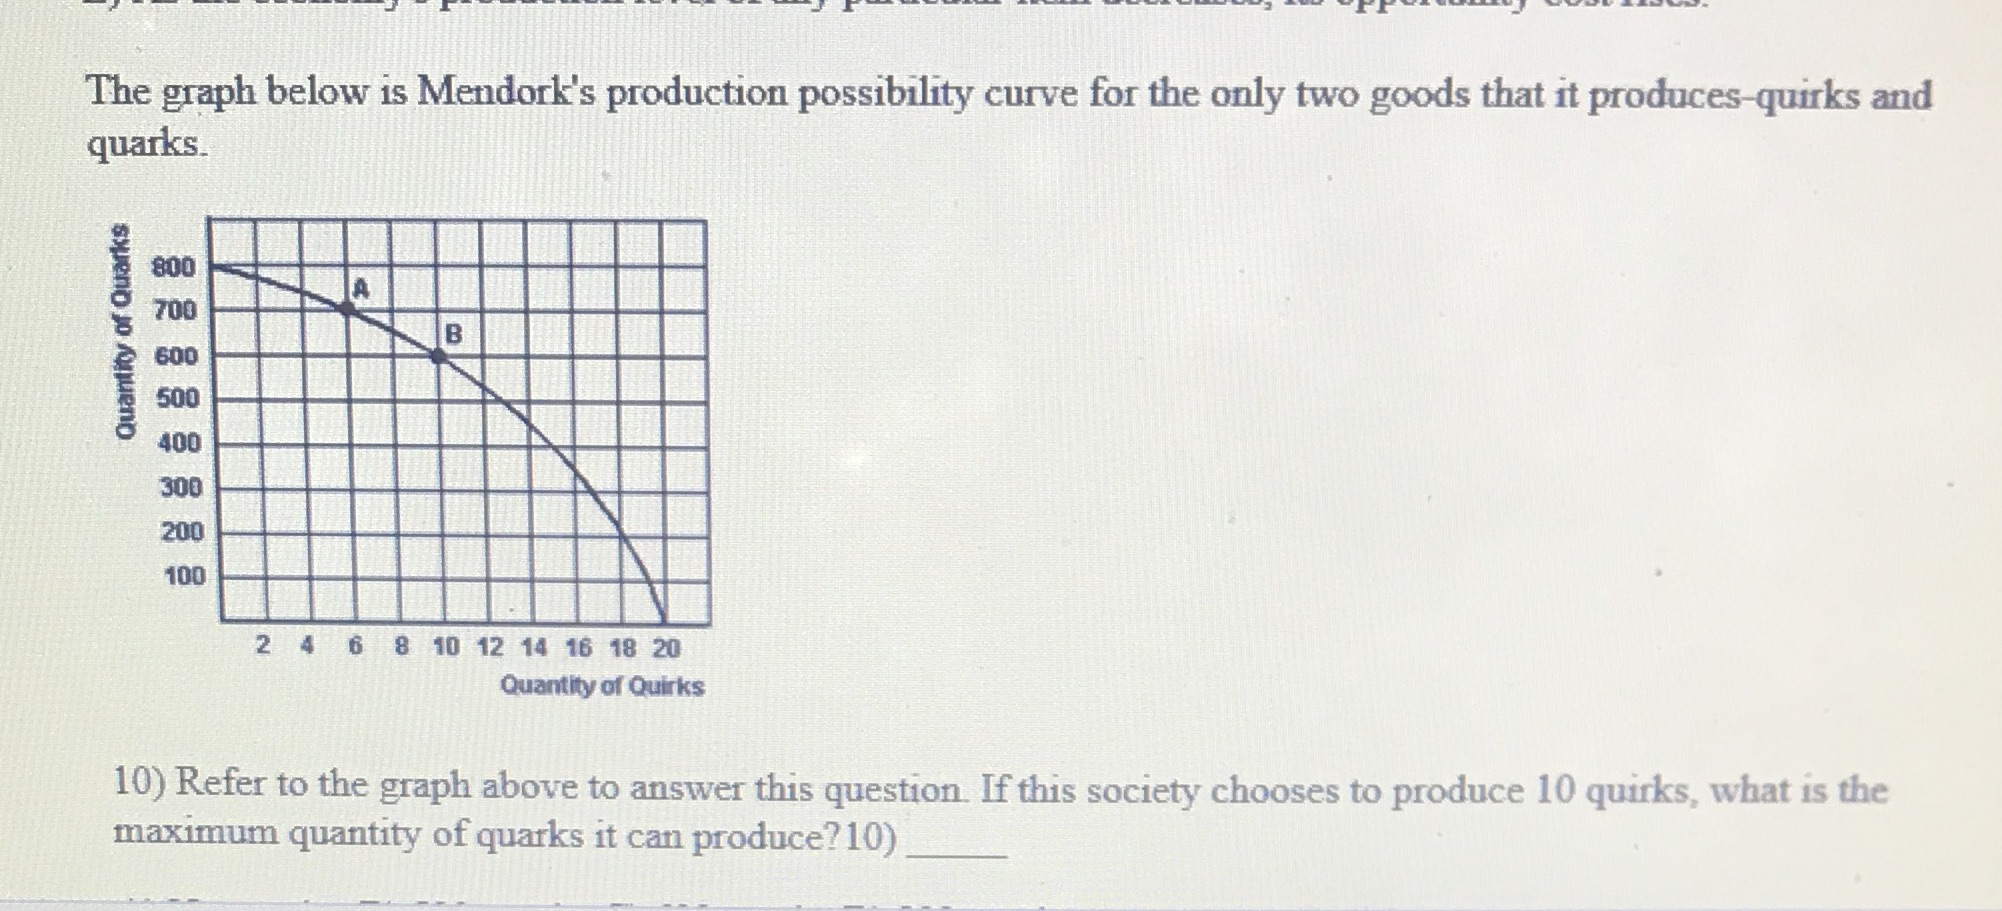
The graph below is Mendork's production possibility curve for the only two goods that it produces-quirks and quarks. 800 Quantity of Quarks B 888 100 2 4 6 8 10 12 14 16 18 20 Quantity of Quirks 10) Refer to the graph above to answer this question. If this society chooses to produce 10 quirks, what is the maximum quantity of quarks it can produce? 10)
Step by Step Solution
There are 3 Steps involved in it
1 Expert Approved Answer
Step: 1 Unlock

Question Has Been Solved by an Expert!
Get step-by-step solutions from verified subject matter experts
Step: 2 Unlock
Step: 3 Unlock