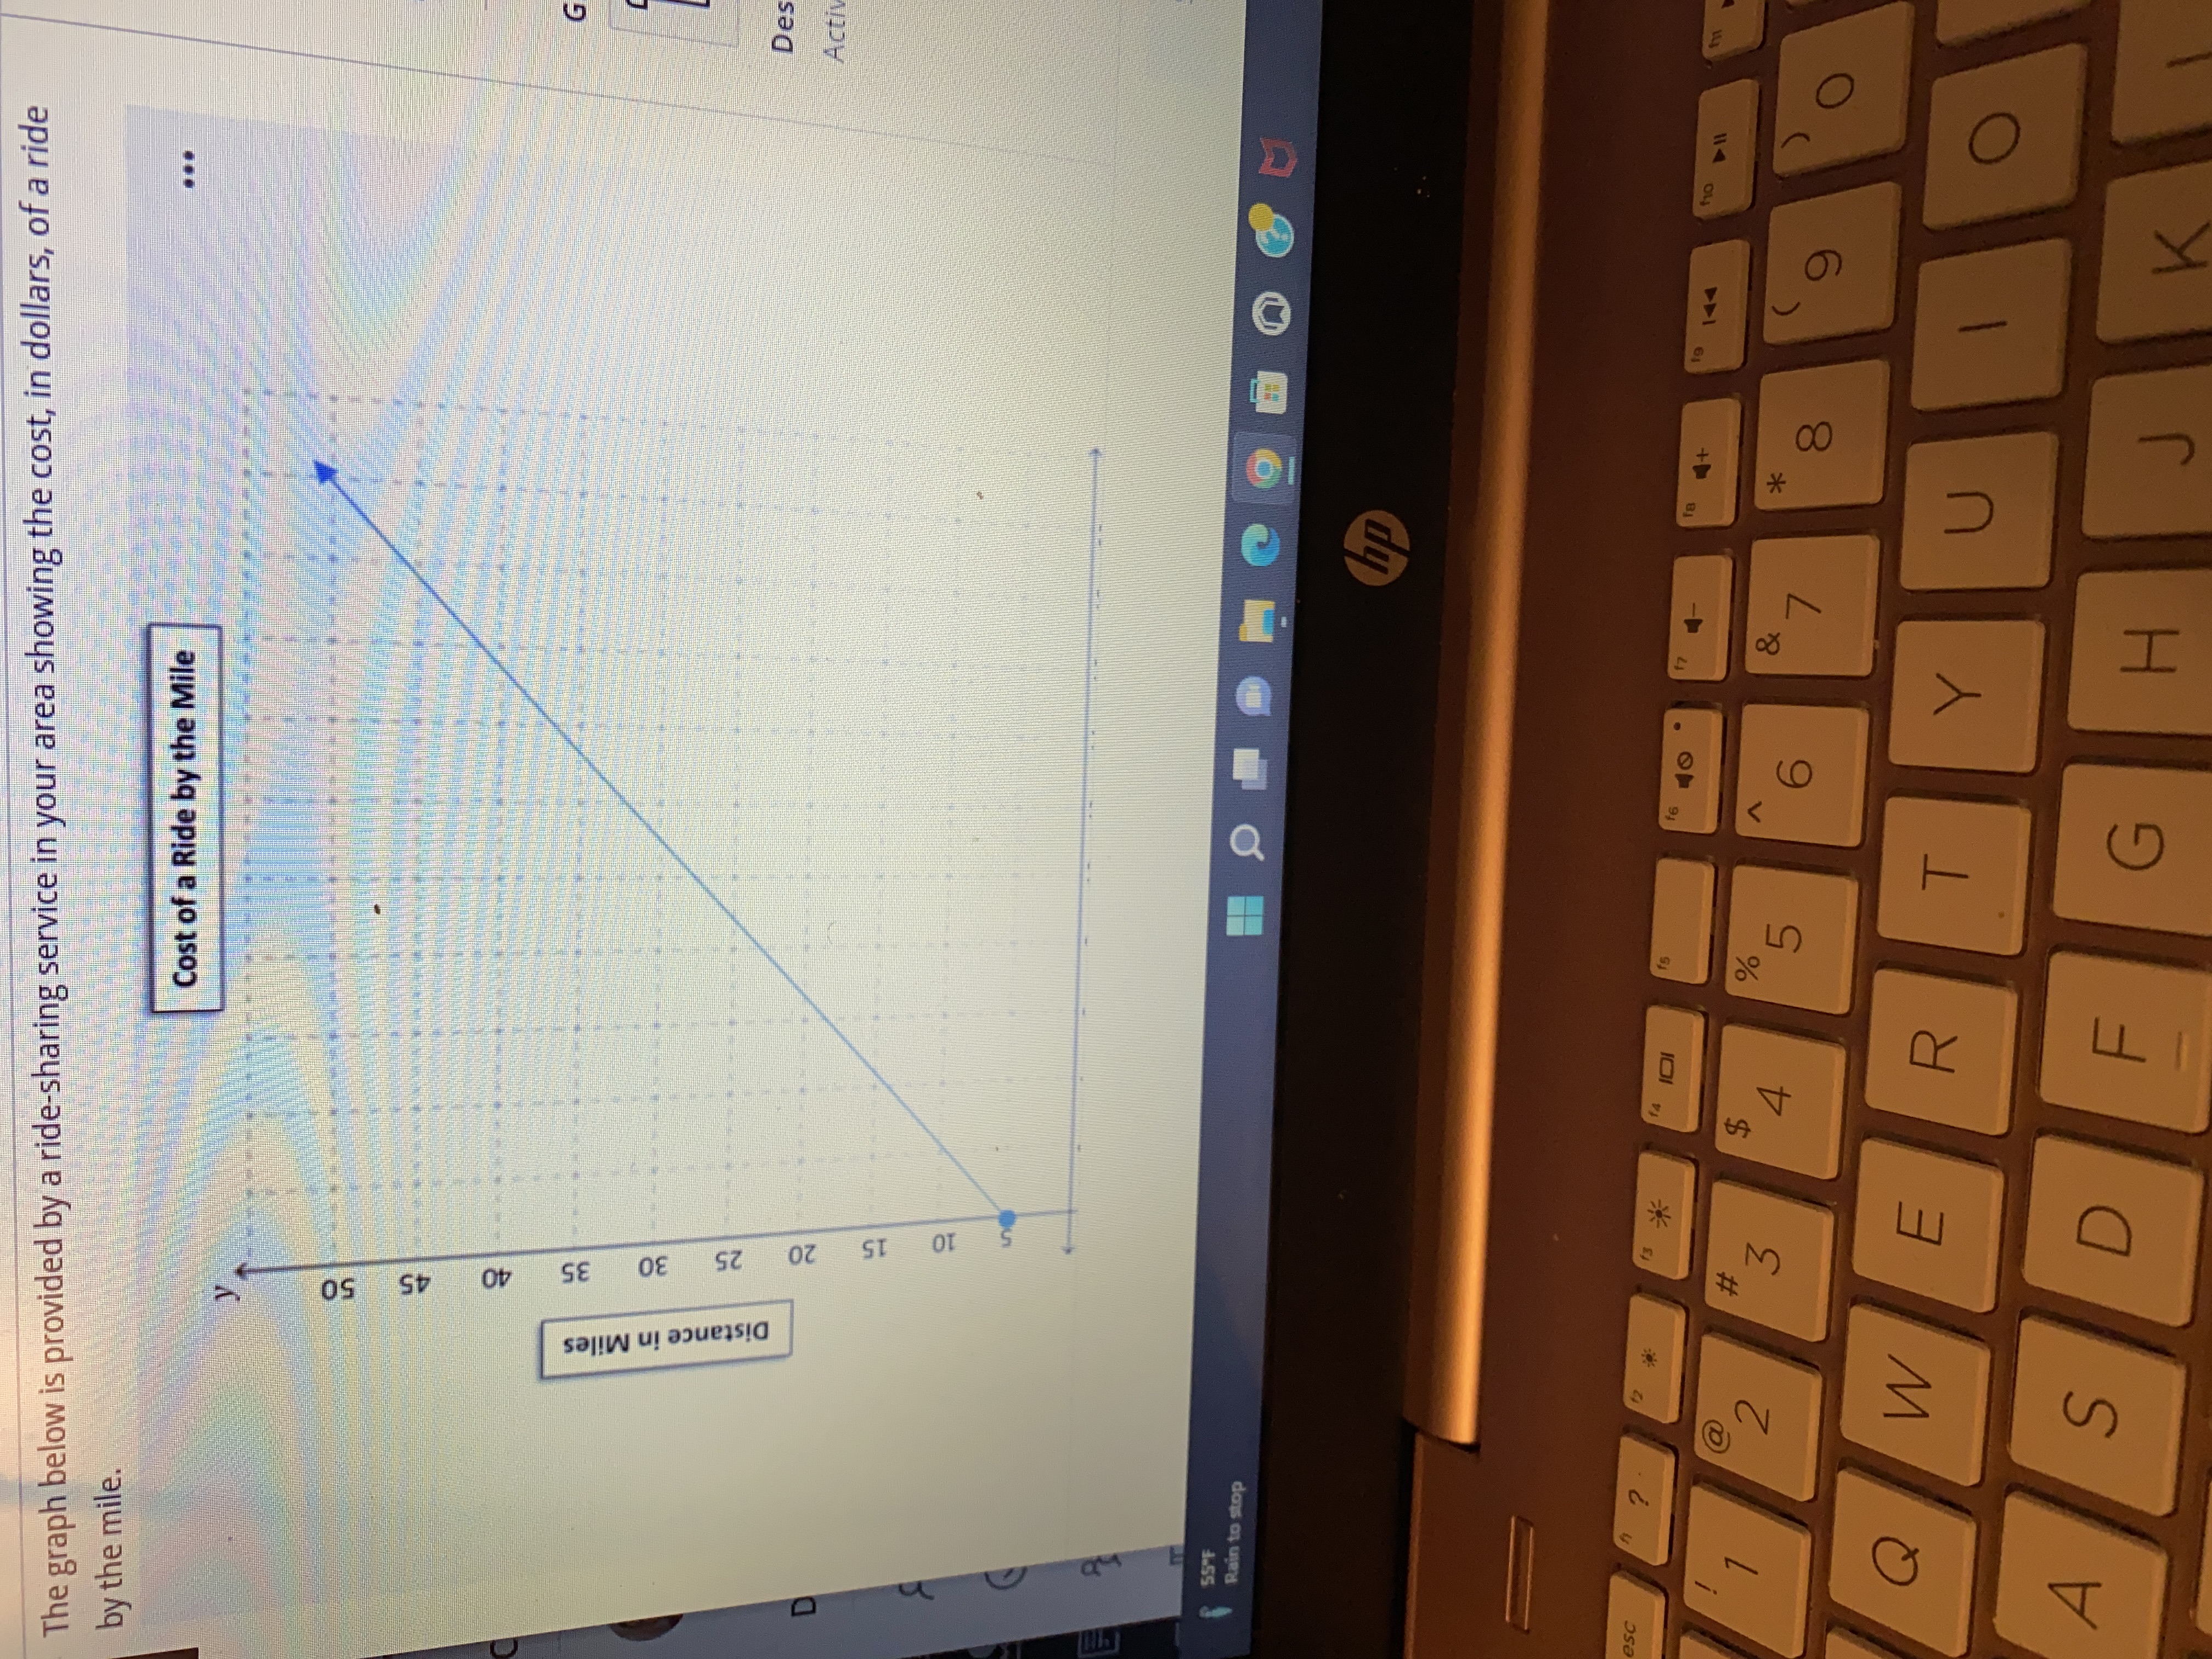
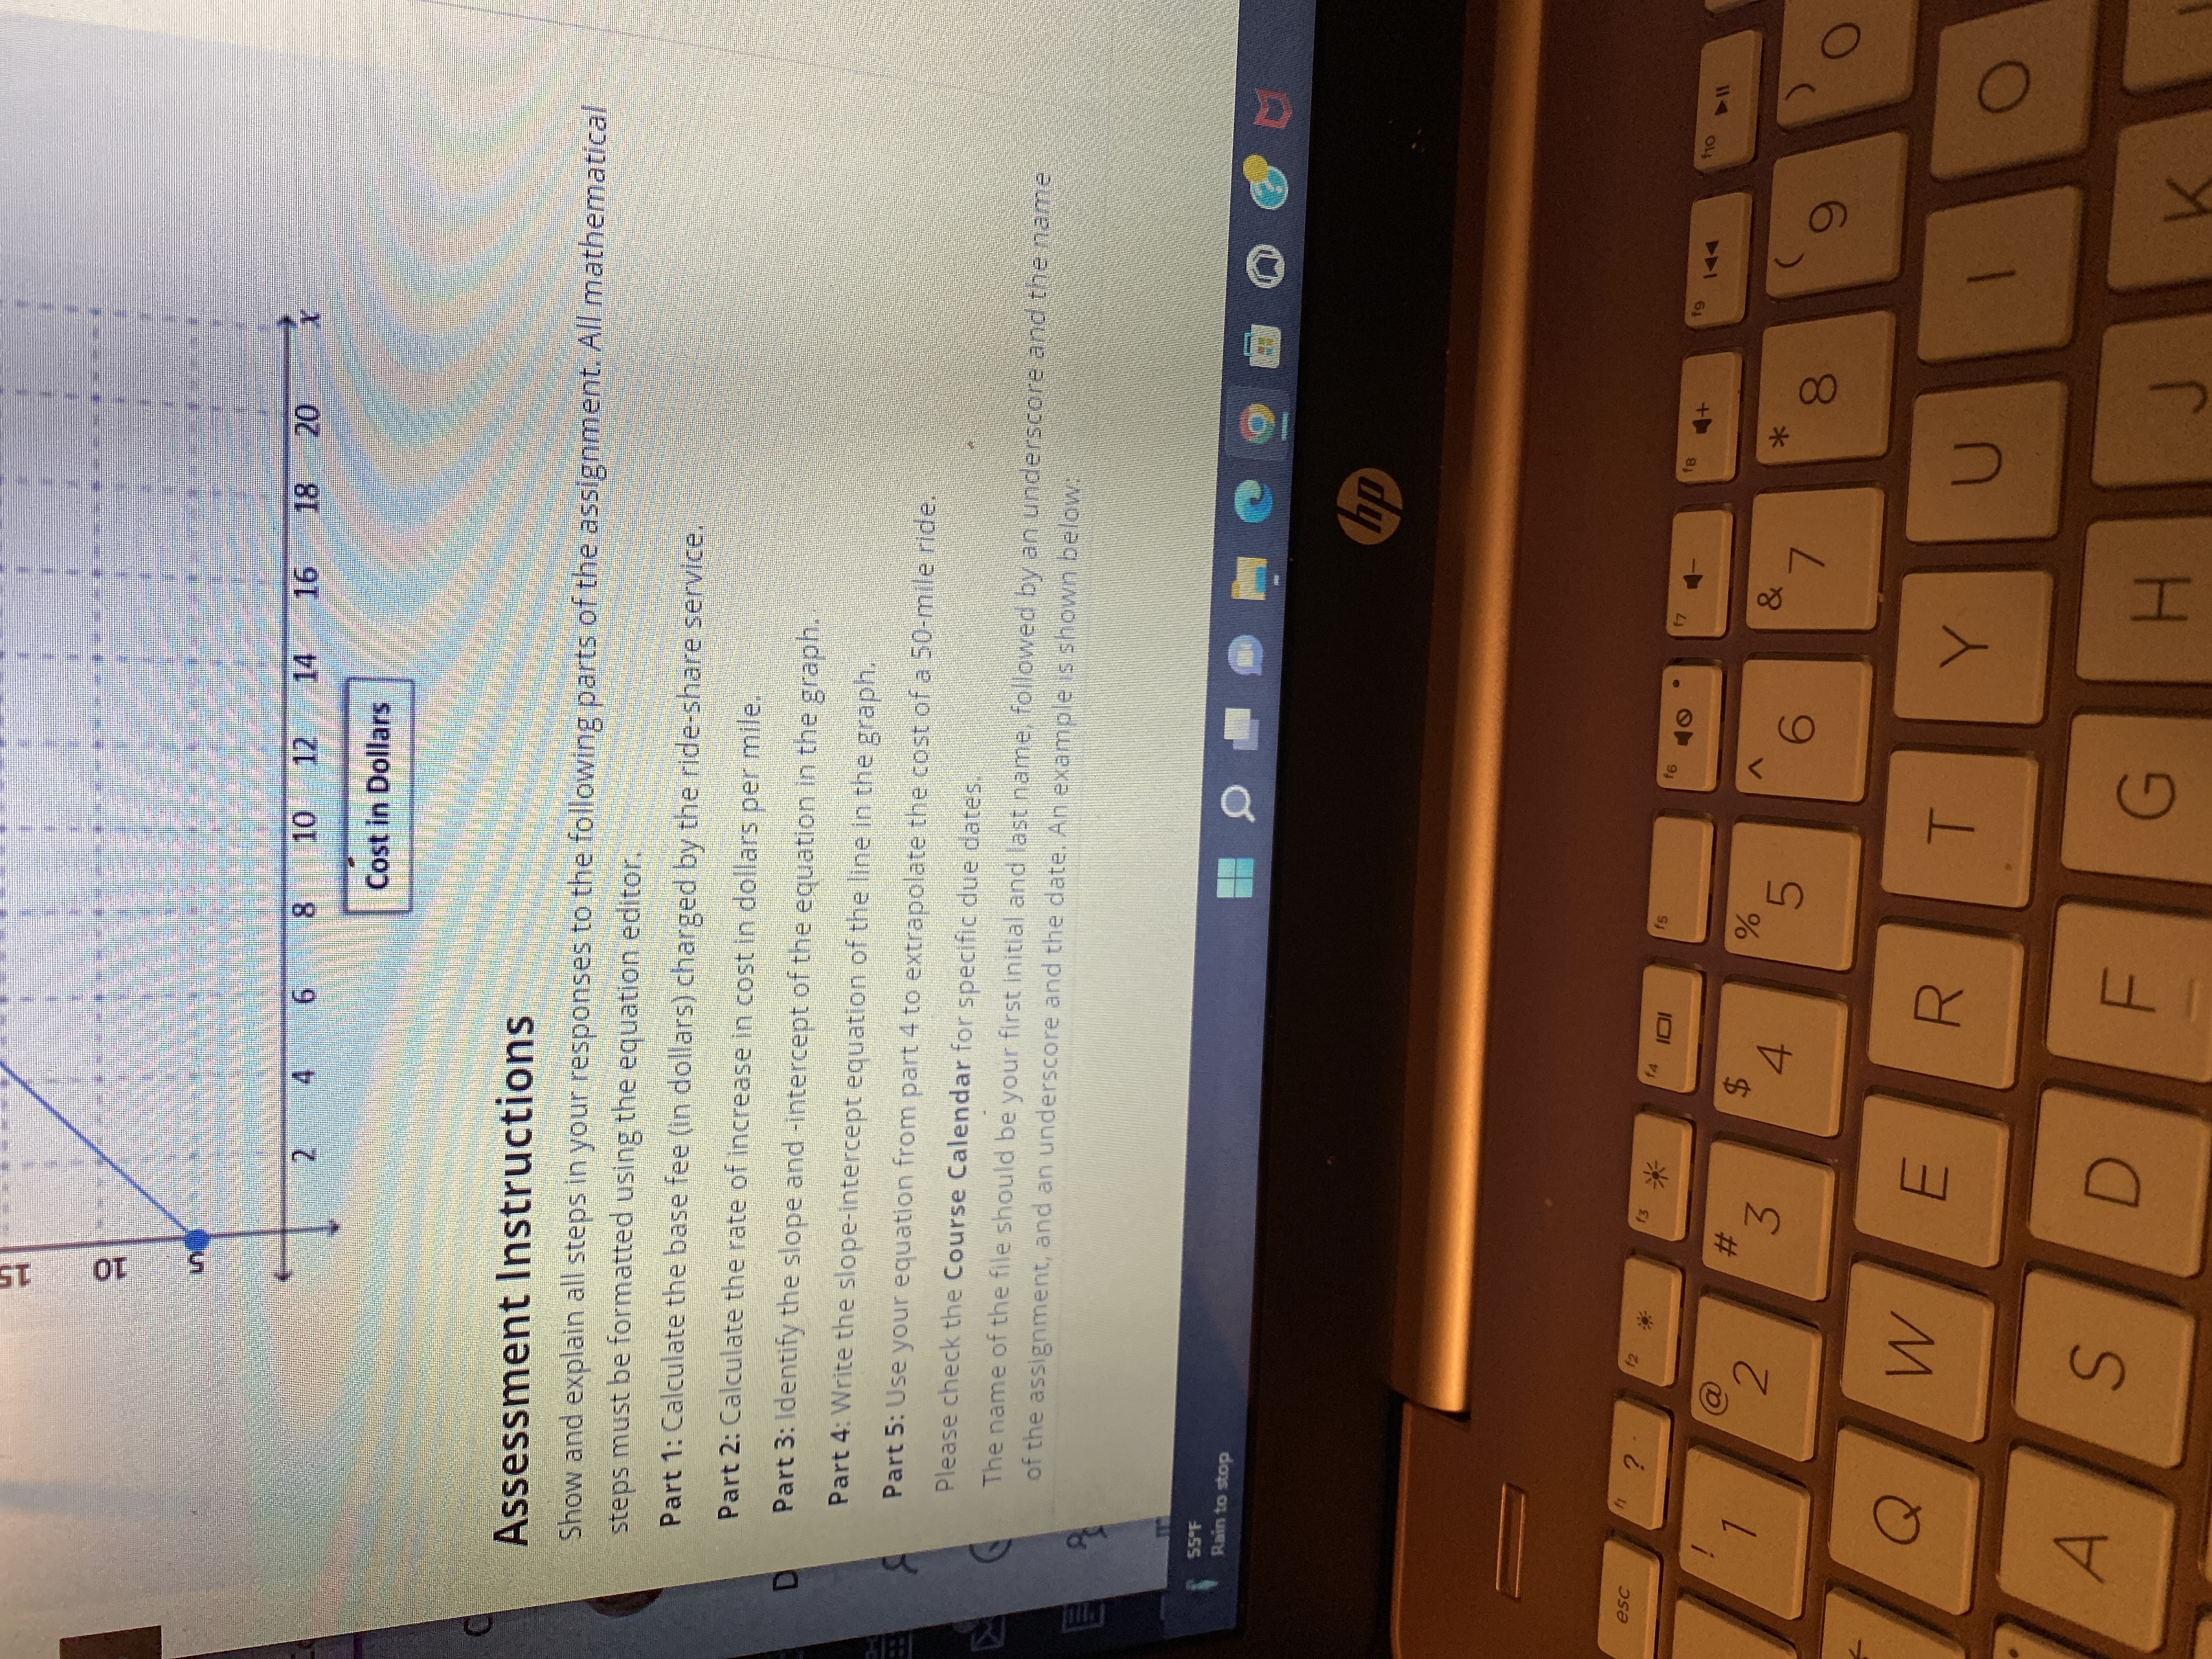
Question: The graph below is provided by a ride-sharing service in your area showing the cost, in dollars, of a ride by the mile. Cost of

The graph below is provided by a ride-sharingThe graph below is provided by a ride-sharing
The graph below is provided by a ride-sharing service in your area showing the cost, in dollars, of a ride by the mile. Cost of a Ride by the Mile 50 45 40 35 30 Des Distance in Miles Acti 25 20 15 10 SSOF Rain to stop 144 110 Il f6 7 esc % & $ 8 O @ 2 # 3 4 5 6 1 O Q W E R T Y U D F H K A S G14 16 18 20 8 10 12 Cost in Dollars Assessment Instructions Show and explain all steps in your responses to the following parts of the assignment. All mathematica steps must be formatted using the equation editor. Part 1: Calculate the base fee (in dollars) charged by the ride-share service. Part 2: Calculate the rate of increase in cost in dollars per mile. Part 3: Identify the slope and -intercept of the equation in the graph. Part 4: Write the slope-intercept equation of the line in the graph. Part 5: Use your equation from part 4 to extrapolate the cost of a 50-mile ride. Please check the Course Calendar for specific due dates. The name of the file should be your first initial and last name, followed by an underscore and the name of the assignment, and an underscore and the date. An example is shown below: SS'F Rain to stop f6 7 8 19 + DII 10 144 esc ? 13 # & 3 4 5 6 8 O Q W E R T Y U O A S D F G H

Step by Step Solution

There are 3 Steps involved in it

1 Expert Approved Answer
Step: 1 Unlock blur-text-image
Question Has Been Solved by an Expert!

Get step-by-step solutions from verified subject matter experts

Step: 2 Unlock
Step: 3 Unlock

Students Have Also Explored These Related Mathematics Questions!