

Question: The graph below models the amount of radioactive element present over the course of a 10-minute experiment Amood of Chom (gas 10.0 10 Time ful
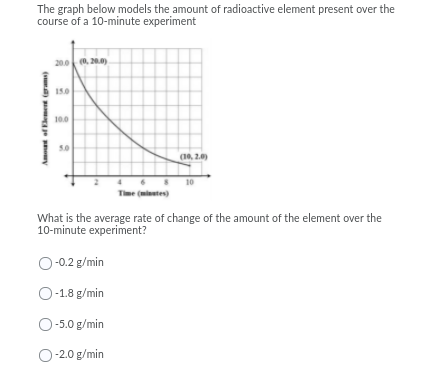
The graph below models the amount of radioactive element present over the course of a 10-minute experiment Amood of Chom (gas 10.0 10 Time ful uter What is the average rate of change of the amount of the element over the 10-minute experiment? O-0.2 g/min O-1.8 g/min O-5.0 g/min O-2.0 g/min
Step by Step Solution
There are 3 Steps involved in it
1 Expert Approved Answer
Step: 1 Unlock

Question Has Been Solved by an Expert!
Get step-by-step solutions from verified subject matter experts
Step: 2 Unlock
Step: 3 Unlock