

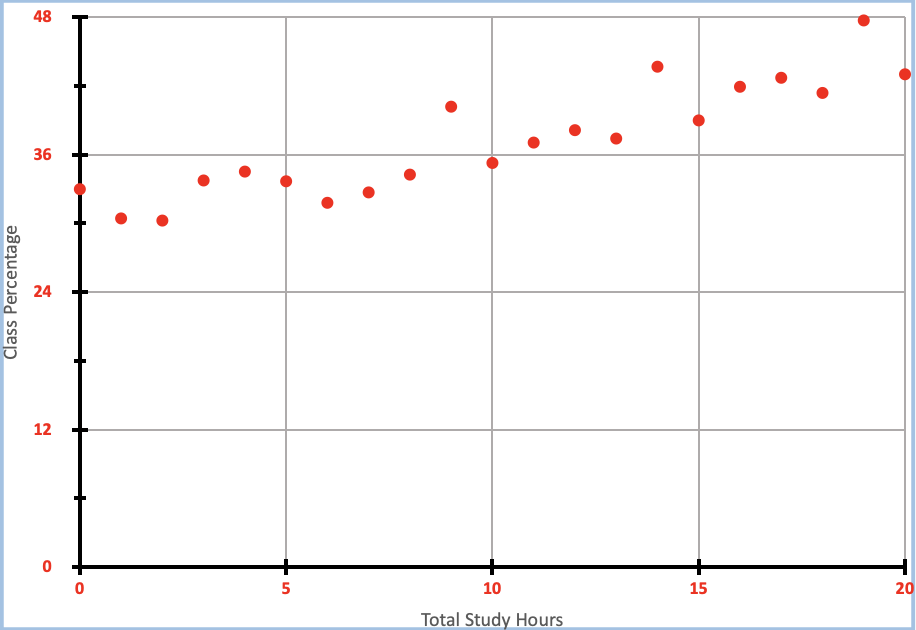
Question: The graph below represents a section of past students' overall class percentage plotted with total time spent studying for the semester. 48 . 36 Class
The graph below represents a section of past students' overall class percentage plotted with total time spent studying for the semester.
Step by Step Solution
There are 3 Steps involved in it
1 Expert Approved Answer
Step: 1 Unlock

Question Has Been Solved by an Expert!
Get step-by-step solutions from verified subject matter experts
Step: 2 Unlock
Step: 3 Unlock