

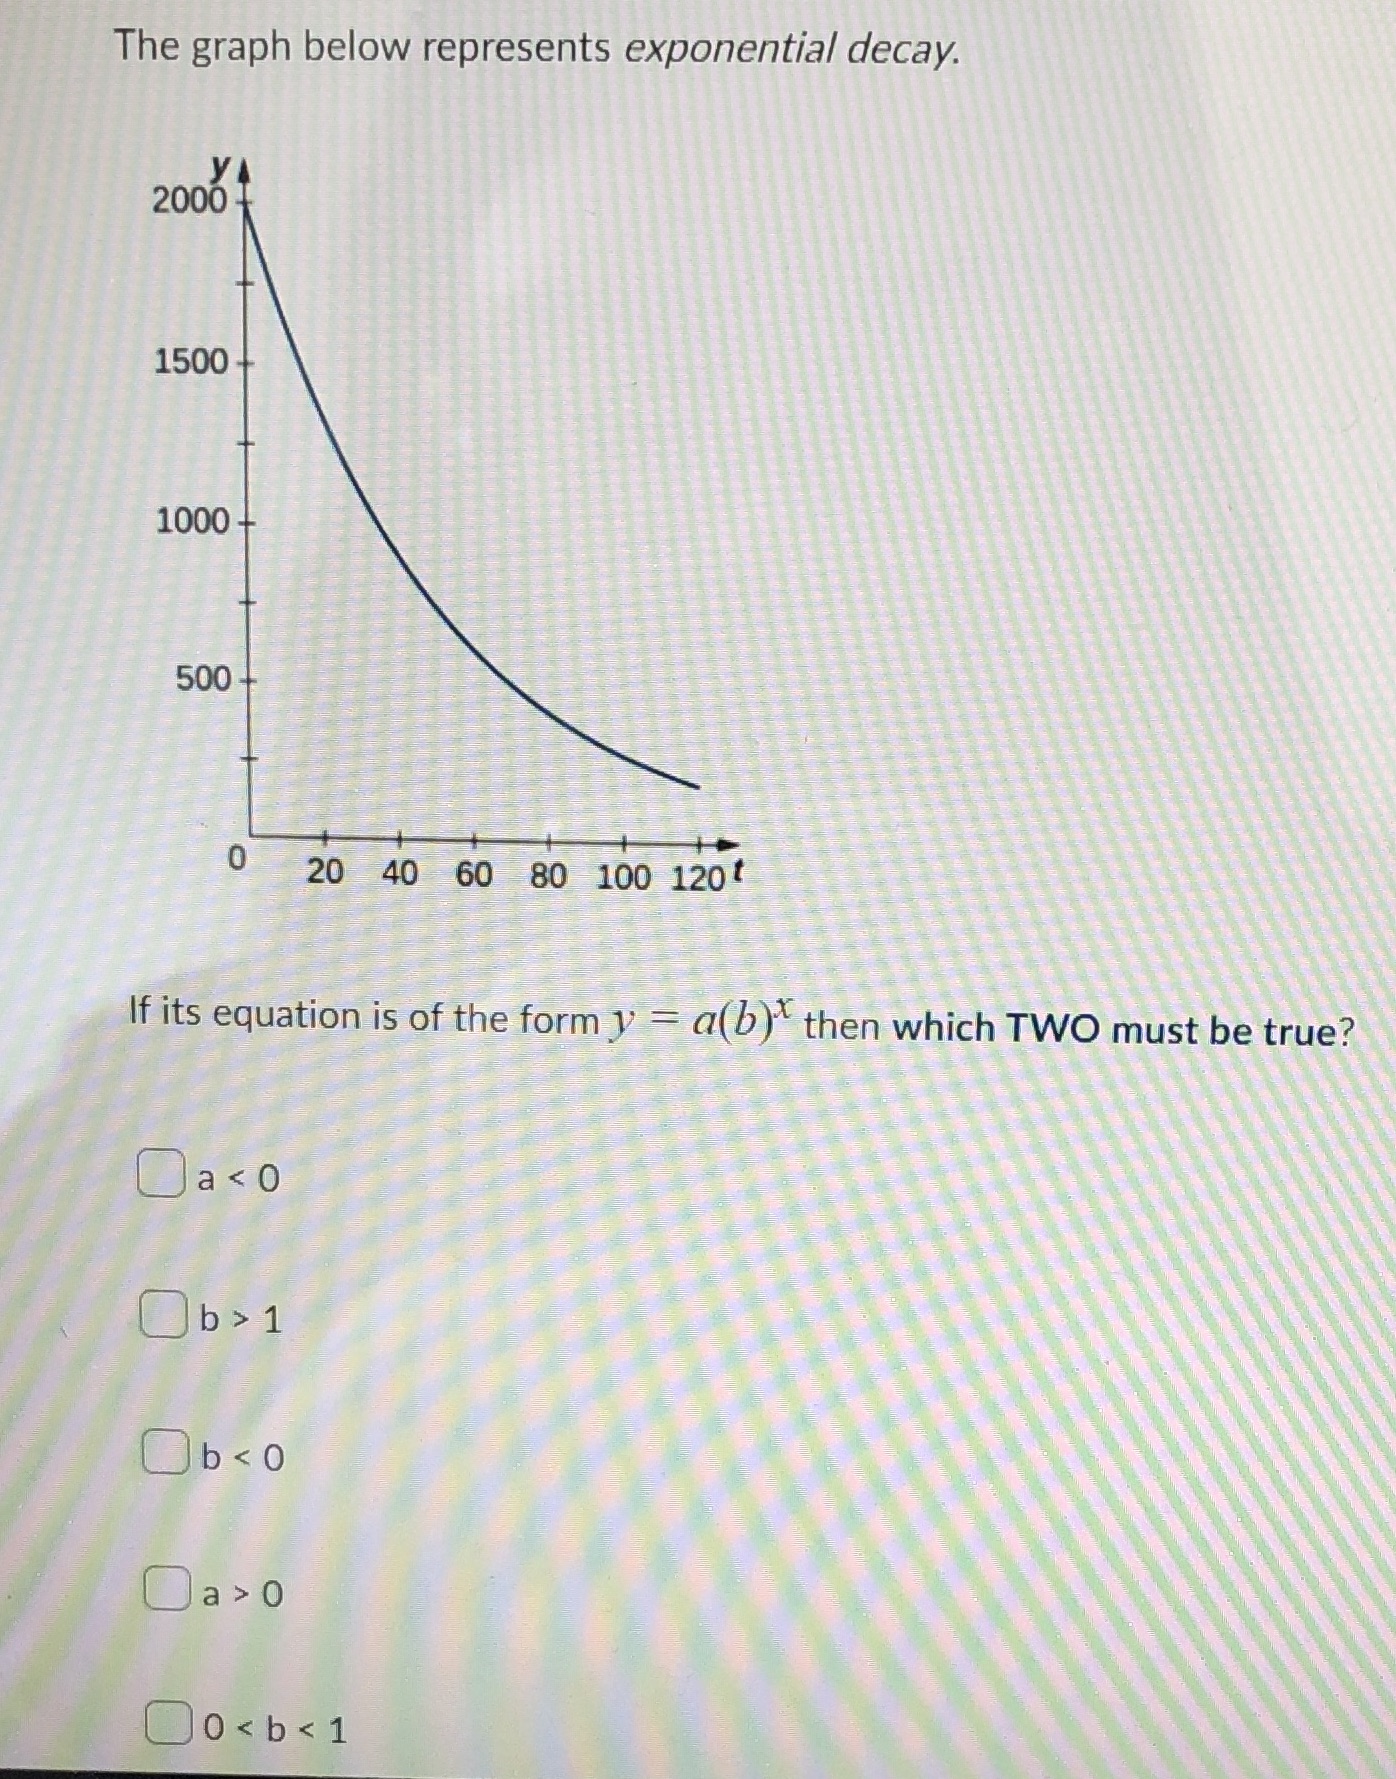
Question: The graph below represents exponential decay. 2000 1500 1000 500 + 0 20 40 60 80 100 120 If its equation is of the form
Step by Step Solution
There are 3 Steps involved in it
1 Expert Approved Answer
Step: 1 Unlock

Question Has Been Solved by an Expert!
Get step-by-step solutions from verified subject matter experts
Step: 2 Unlock
Step: 3 Unlock