

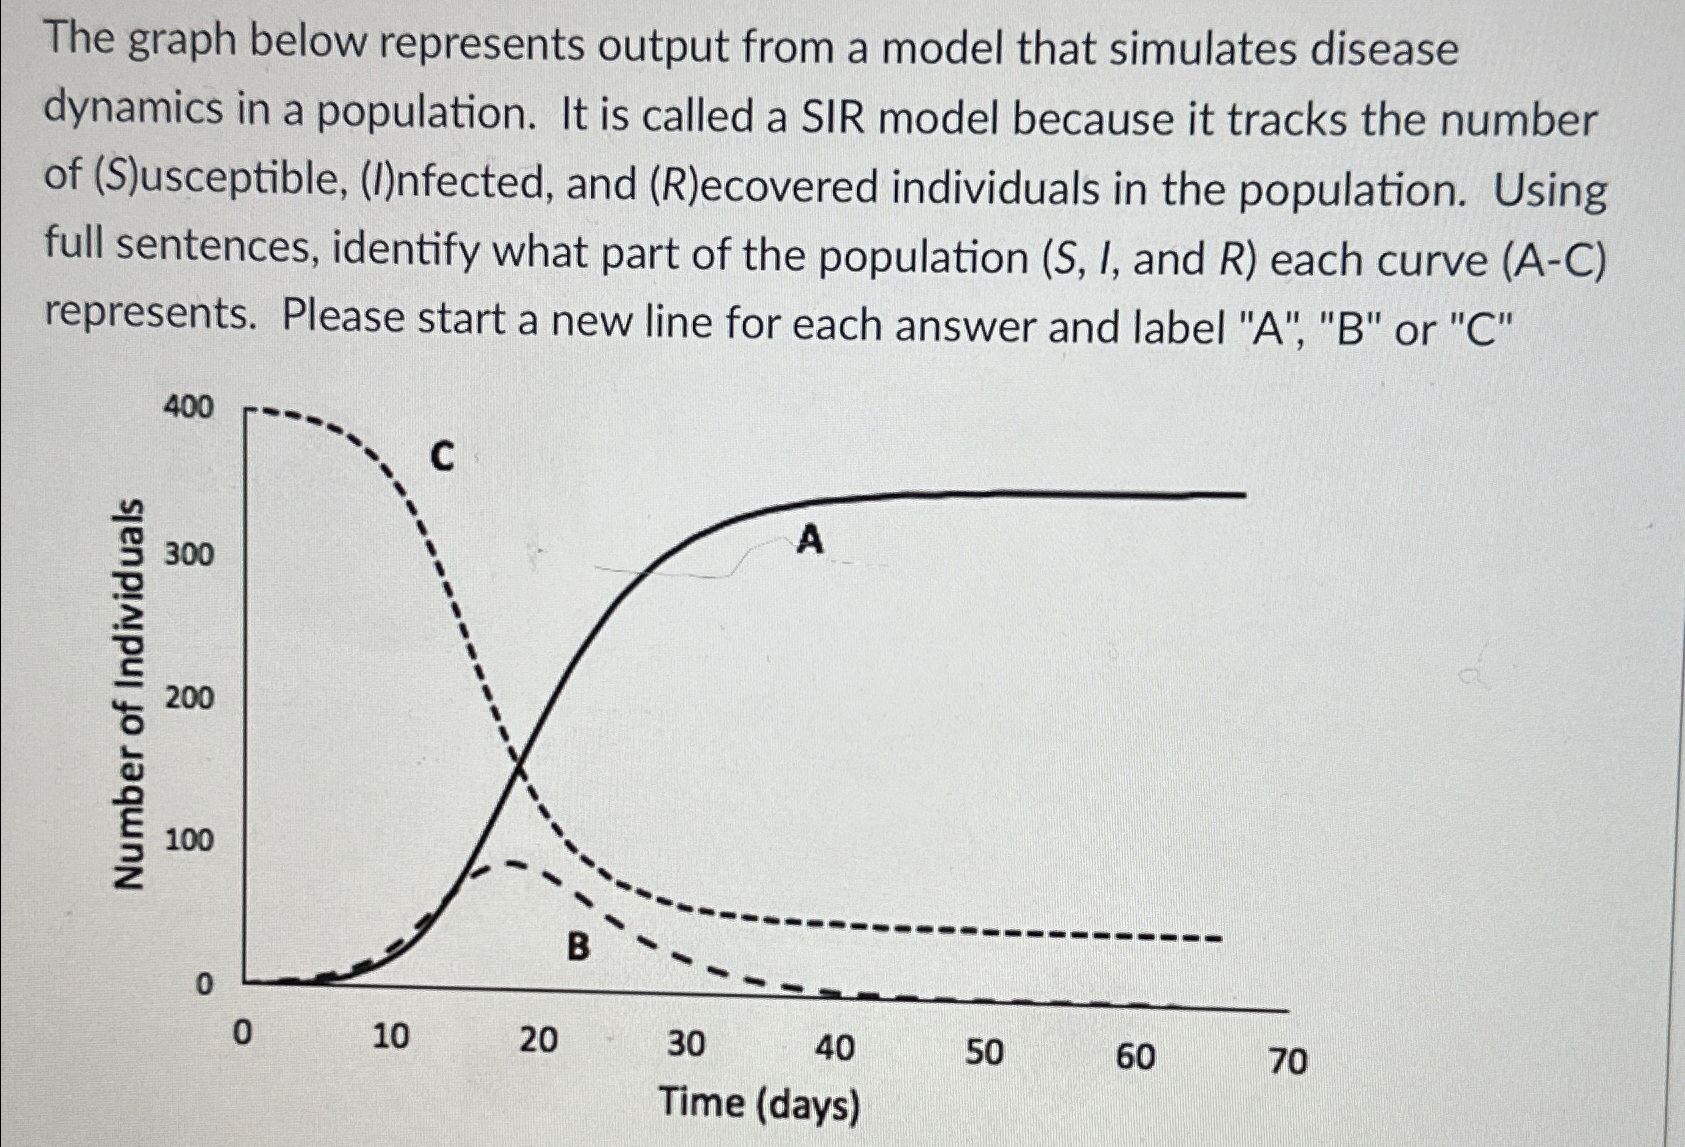
Question: The graph below represents output from a model that simulates disease dynamics in a population. It is called a SIR model because it tracks the
The graph below represents output from a model that simulates disease dynamics in a population. It is called a SIR model because it tracks the number of SusceptibleInfected and Recovered individuals in the population. Using full sentences, identify what part of the population I, and each curve AC represents. Please start a new line for each answer and label AB or C
Step by Step Solution
There are 3 Steps involved in it
1 Expert Approved Answer
Step: 1 Unlock

Question Has Been Solved by an Expert!
Get step-by-step solutions from verified subject matter experts
Step: 2 Unlock
Step: 3 Unlock