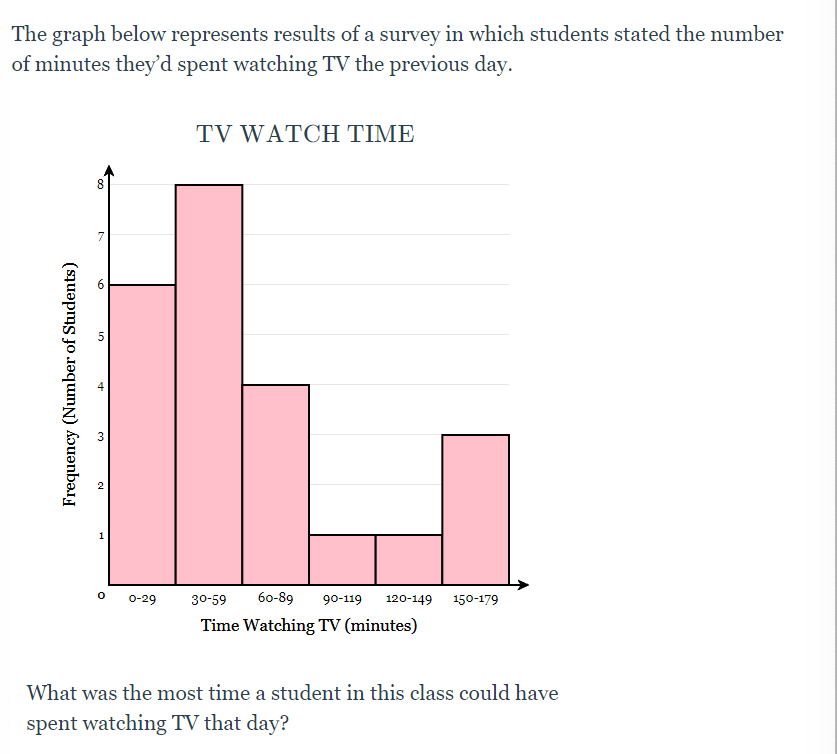
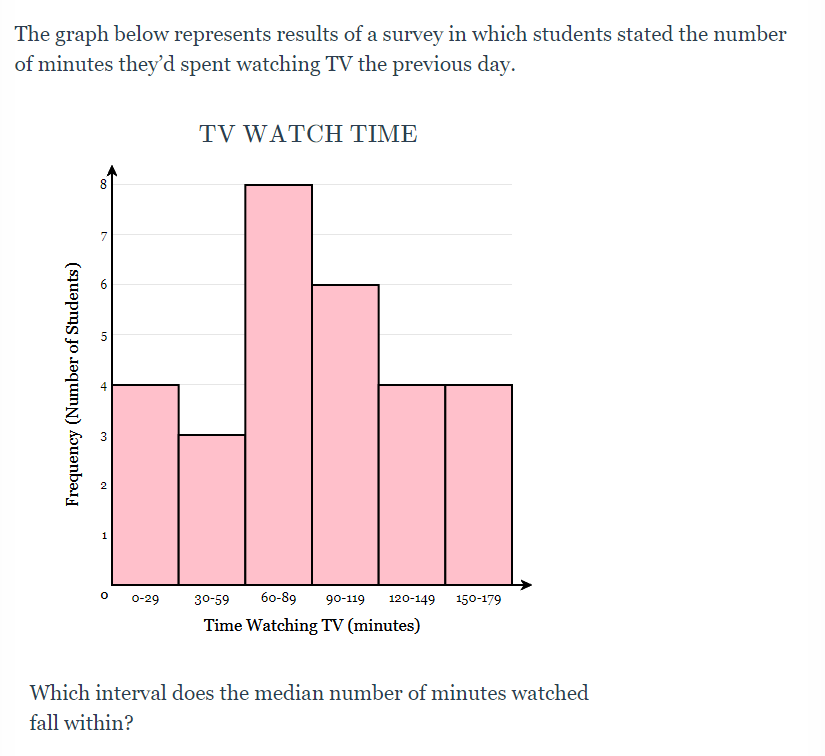
The graph below represents results of a survey in which students stated the number of minutes...
Fantastic news! We've Found the answer you've been seeking!
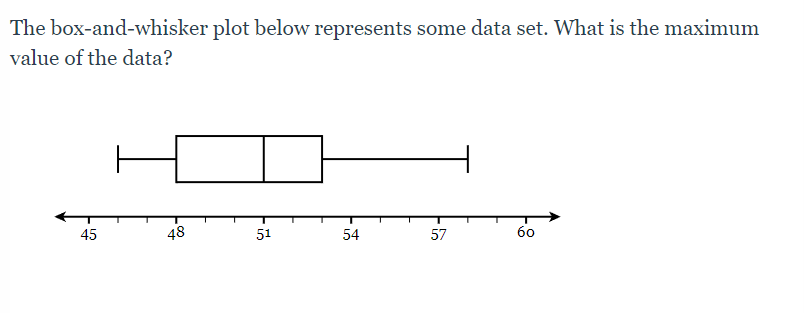
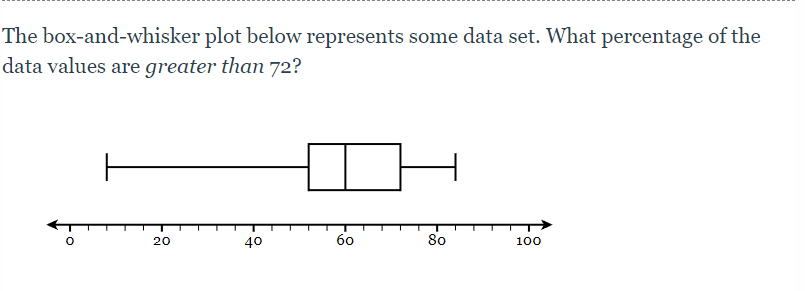
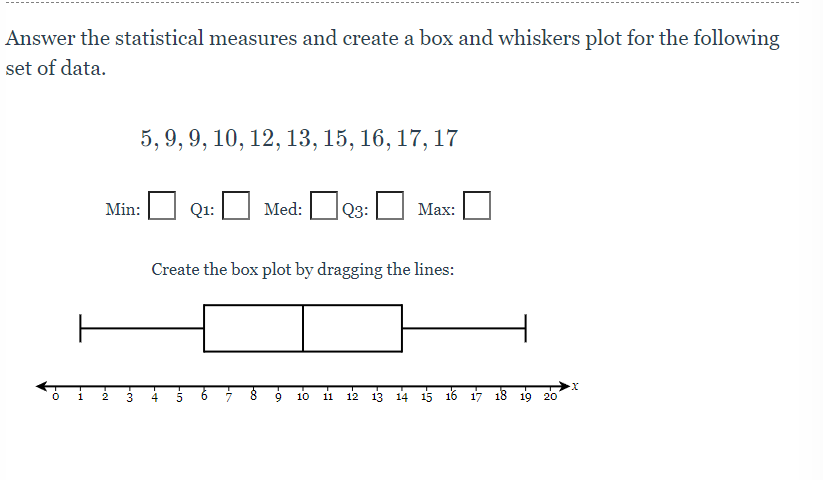
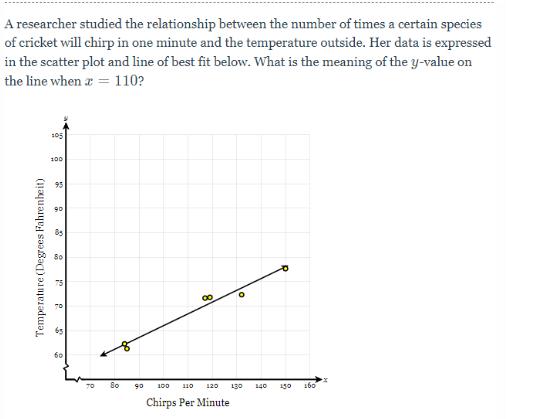
Question:
Transcribed Image Text:
The graph below represents results of a survey in which students stated the number of minutes they'd spent watching TV the previous day. TV WATCH TIME -- 6 + Frequency (Number of Students) 120-149 150-179 Time Watching TV (minutes) 0-29 30-59 60-89 90-119 What was the most time a student in this class could have spent watching TV that day? The dot plot below represents how long it takes students in a 7th grade math class to get to school every morning. COMMUTE TIME ... - 5 10 15 20 25 30 35 40 45 Minutes How many students take less than 20 minutes to get to school? The graph below represents results of a survey in which students stated the number of minutes they'd spent watching TV the previous day. TV WATCH TIME Frequency (Number of Students) 8 6 3 19 0-29 30-59 60-89 90-119 120-149 150-179 Time Watching TV (minutes) Which interval does the median number of minutes watched fall within? Complete the frequency table for the following set of data. You may optionally click a number to shade it out. 24, 26, 12, 23, 29, 9, 3, 25, 0, 25, 21, 0, 4, 0, 10, 26, 13, 0, 0, 11, 8, 13, 4, 15, 28, 11, 9, 21, 26, 6 *Click the tally box to count up. The minus counts down. Interval Tally 0-4 Frequency 0 5-9 10-14 15-19 20-24 25-29 0 0 The box-and-whisker plot below represents some data set. What is the maximum value of the data? 45 48 51 54 57 60 The box-and-whisker plot below represents some data set. What percentage of the data values are greater than 72? 20 40 60 -8 80 100 Answer the statistical measures and create a box and whiskers plot for the following set of data. 5, 9, 9, 10, 12, 13, 15, 16, 17, 17 Min: Q1: Med: Q3: Max: Create the box plot by dragging the lines: T 1 2 3 9 10 11 12 13 14 15 16 17 18 19 20 A researcher studied the relationship between the number of times a certain species of cricket will chirp in one minute and the temperature outside. Her data is expressed in the scatter plot and line of best fit below. What is the meaning of the y-value on the line when a 110? = Temperature (Degrees Fahrenheit) 105 100 95 90 85 80 00 70 80 90 100 110 120 130 140 150 160 Chirps Per Minute The graph below represents results of a survey in which students stated the number of minutes they'd spent watching TV the previous day. TV WATCH TIME -- 6 + Frequency (Number of Students) 120-149 150-179 Time Watching TV (minutes) 0-29 30-59 60-89 90-119 What was the most time a student in this class could have spent watching TV that day? The dot plot below represents how long it takes students in a 7th grade math class to get to school every morning. COMMUTE TIME ... - 5 10 15 20 25 30 35 40 45 Minutes How many students take less than 20 minutes to get to school? The graph below represents results of a survey in which students stated the number of minutes they'd spent watching TV the previous day. TV WATCH TIME Frequency (Number of Students) 8 6 3 19 0-29 30-59 60-89 90-119 120-149 150-179 Time Watching TV (minutes) Which interval does the median number of minutes watched fall within? Complete the frequency table for the following set of data. You may optionally click a number to shade it out. 24, 26, 12, 23, 29, 9, 3, 25, 0, 25, 21, 0, 4, 0, 10, 26, 13, 0, 0, 11, 8, 13, 4, 15, 28, 11, 9, 21, 26, 6 *Click the tally box to count up. The minus counts down. Interval Tally 0-4 Frequency 0 5-9 10-14 15-19 20-24 25-29 0 0 The box-and-whisker plot below represents some data set. What is the maximum value of the data? 45 48 51 54 57 60 The box-and-whisker plot below represents some data set. What percentage of the data values are greater than 72? 20 40 60 -8 80 100 Answer the statistical measures and create a box and whiskers plot for the following set of data. 5, 9, 9, 10, 12, 13, 15, 16, 17, 17 Min: Q1: Med: Q3: Max: Create the box plot by dragging the lines: T 1 2 3 9 10 11 12 13 14 15 16 17 18 19 20 A researcher studied the relationship between the number of times a certain species of cricket will chirp in one minute and the temperature outside. Her data is expressed in the scatter plot and line of best fit below. What is the meaning of the y-value on the line when a 110? = Temperature (Degrees Fahrenheit) 105 100 95 90 85 80 00 70 80 90 100 110 120 130 140 150 160 Chirps Per Minute
Expert Answer:
Related Book For
Posted Date:
Students also viewed these mathematics questions
-
This assignment requires you to complete the 2022 tax reporting for a fictional woman named Anna Smith. Question 1 T1 - step 4 - line 66 This is Anna's taxable income Answer: Question 2 T1 - step...
-
How would this photo be different if the two people were both Americans?
-
McQueen Corp. issued 7.5% seven-year bonds payable with a face amount of $90,000 when the market interest rate was 7.5%. Assume that the accounting year of McQueen ends on December 31 and that bonds...
-
A single force with x-component F x acts on a 500 g object as it moves along the x-axis. The objects acceleration graph (a x versus t) is shown in Figure P5.31. Draw a graph of F x versus t. a, (m/s)...
-
Determine whether each of the following is true or false. In each case, assume \(P\) is located at \(t=0\) and \(F\) is located at \(t=n\), and the \(A\) s are spread uniformly over the planning...
-
(Issuance of Bonds with Stock Warrants) On May 1, 2010, Barkley Company issued 3,000 $1,000 bonds at 102. Each bond was issued with one detachable stock warrant. Shortly after issuance, the bonds...
-
A wheel initially at rest begins rotating because of a constant angular acceleration. During a certain interval AT = 13s, the wheel goes through 84 rev and reaches an angular speed of 11 rev/s. (a)...
-
Let X have a continuous, strictly increasing CDF F. Let Y = F(X). Find the density of Y. This is called the probability integral transform. Now let U ti Uniform(0, 1) and let X = F-1(U). Show that X...
-
Explain the difference between wide area networks (WANs) and local area networks (LANs).
-
What is a systems flowchart?
-
Describe four risk responses.
-
What is the difference in implementation of a one-to-many and a oneto- one relationship in a relational database model?
-
What are information processing activities?
-
Draw a P-T diagram of a system undergoing the following two processes: (a) An isothermal compression from 500 K and 250 kPa to a pressure of 500 kPa (b) An isobaric cooling to a temperature of 350 K
-
How does the organizational structure of an MNC influence its strategy implementation?
-
The data sets represent simple random samples from a population whose mean is 100. (a) Compute the sample mean of each data set. (b) For each data set, construct a 95% condence interval about the...
-
In the game of roulette, a wheel consists of 38 slots numbered 0, 00, 1, 2, . . . , 36. To play the game, a metal ball is spun around the wheel and is allowed to fall into one of the numbered slots....
-
Compute the probability of the event E = {1, 2, 3}. Let the sample space be S = {1, 2, 3, 4, 5, 6, 7, 8, 9, 10}. Suppose the outcomes are equally likely.
-
Which strategy for entering a new international market should (a) an architectural design firm, (b) an online discount broker, and (c) a satellite TV channel consider, and why?
-
How can a firm design perceived control into a service encounter? Apply it to one face-to-face and one online encounter.
-
Give examples of how Internet and telecommunications technologies (e.g., mobile commerce [M-Commerce] and apps) have changed some of the services you use.
Study smarter with the SolutionInn App