

Question: The graph below represents the distance-time relationship from Justin and Nicole as they cycled on a road from mile marker to mile marker 4.5
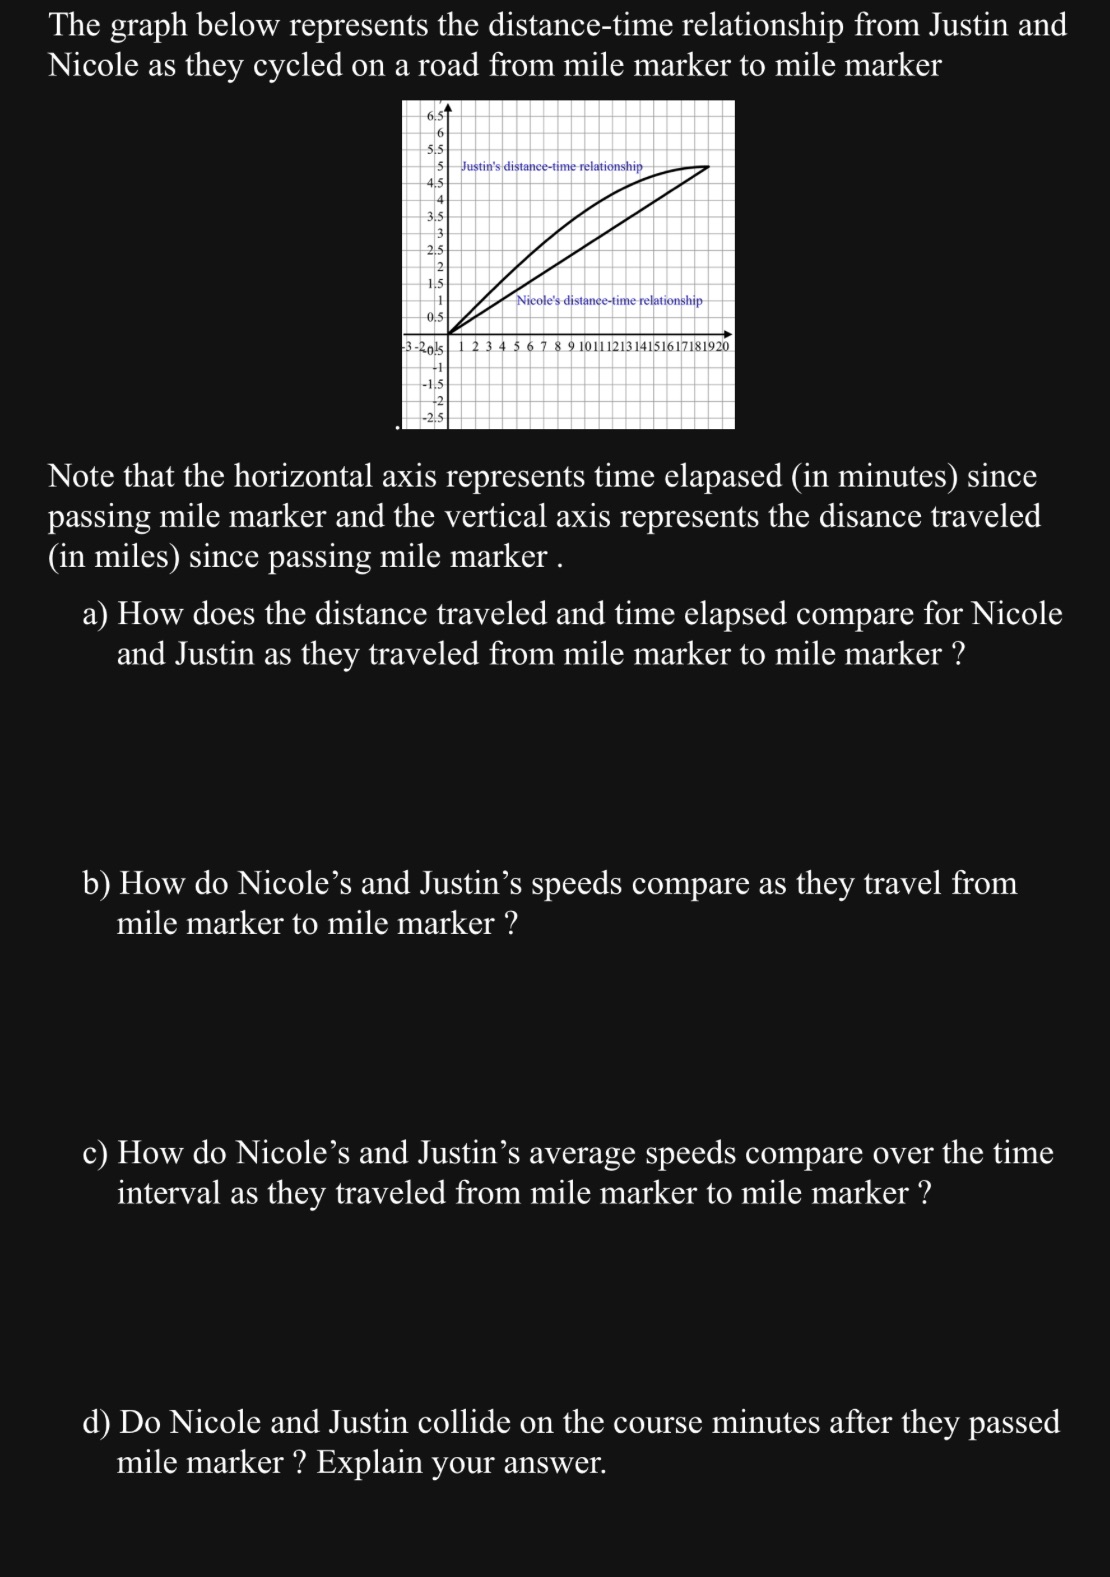
The graph below represents the distance-time relationship from Justin and Nicole as they cycled on a road from mile marker to mile marker 4.5 4 3.5 3 2,5 1.5 0.5 Justin's distance-time relationship Nicole's distance-time relationship -3-2015 1 2 3 4 5 6 7 8 9 1011121314151617181920 Note that the horizontal axis represents time elapased (in minutes) since passing mile marker and the vertical axis represents the disance traveled (in miles) since passing mile marker. a) How does the distance traveled and time elapsed compare for Nicole and Justin as they traveled from mile marker to mile marker ? b) How do Nicole's and Justin's speeds compare as they travel from mile marker to mile marker ? c) How do Nicole's and Justin's average speeds compare over the time interval as they traveled from mile marker to mile marker ? d) Do Nicole and Justin collide on the course minutes after they passed mile marker ? Explain your answer.
Step by Step Solution
There are 3 Steps involved in it

Get step-by-step solutions from verified subject matter experts