

Question: The graph below represents the estimated price / yield relationship for two mortgage - backed securities , taking into account expected prepayment and default behavior.
The graph below represents the estimated priceyield
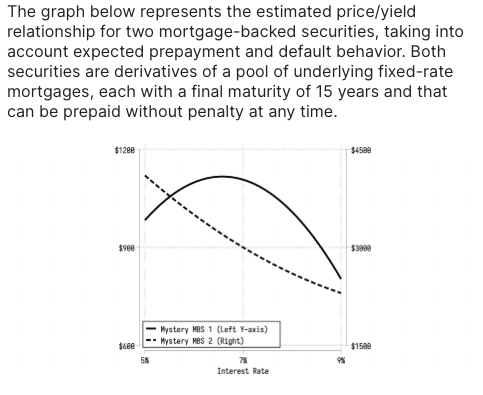
relationship for two mortgagebacked securities taking into
account expected prepayment and default behavior. Both
securities are derivatives of a pool of underlying fixedrate
mortgages, each with a final maturity of years and that
can be prepaid without penalty at any time.
Question:
A Which is the Interest Only IO
a MBS
b MBS
B Which of these securities has a negative effective duration when interest rate is at
a MBS
b MBS
C Which of these securities has a negative convexity when interest rate is at
Step by Step Solution
There are 3 Steps involved in it
1 Expert Approved Answer
Step: 1 Unlock

Question Has Been Solved by an Expert!
Get step-by-step solutions from verified subject matter experts
Step: 2 Unlock
Step: 3 Unlock