

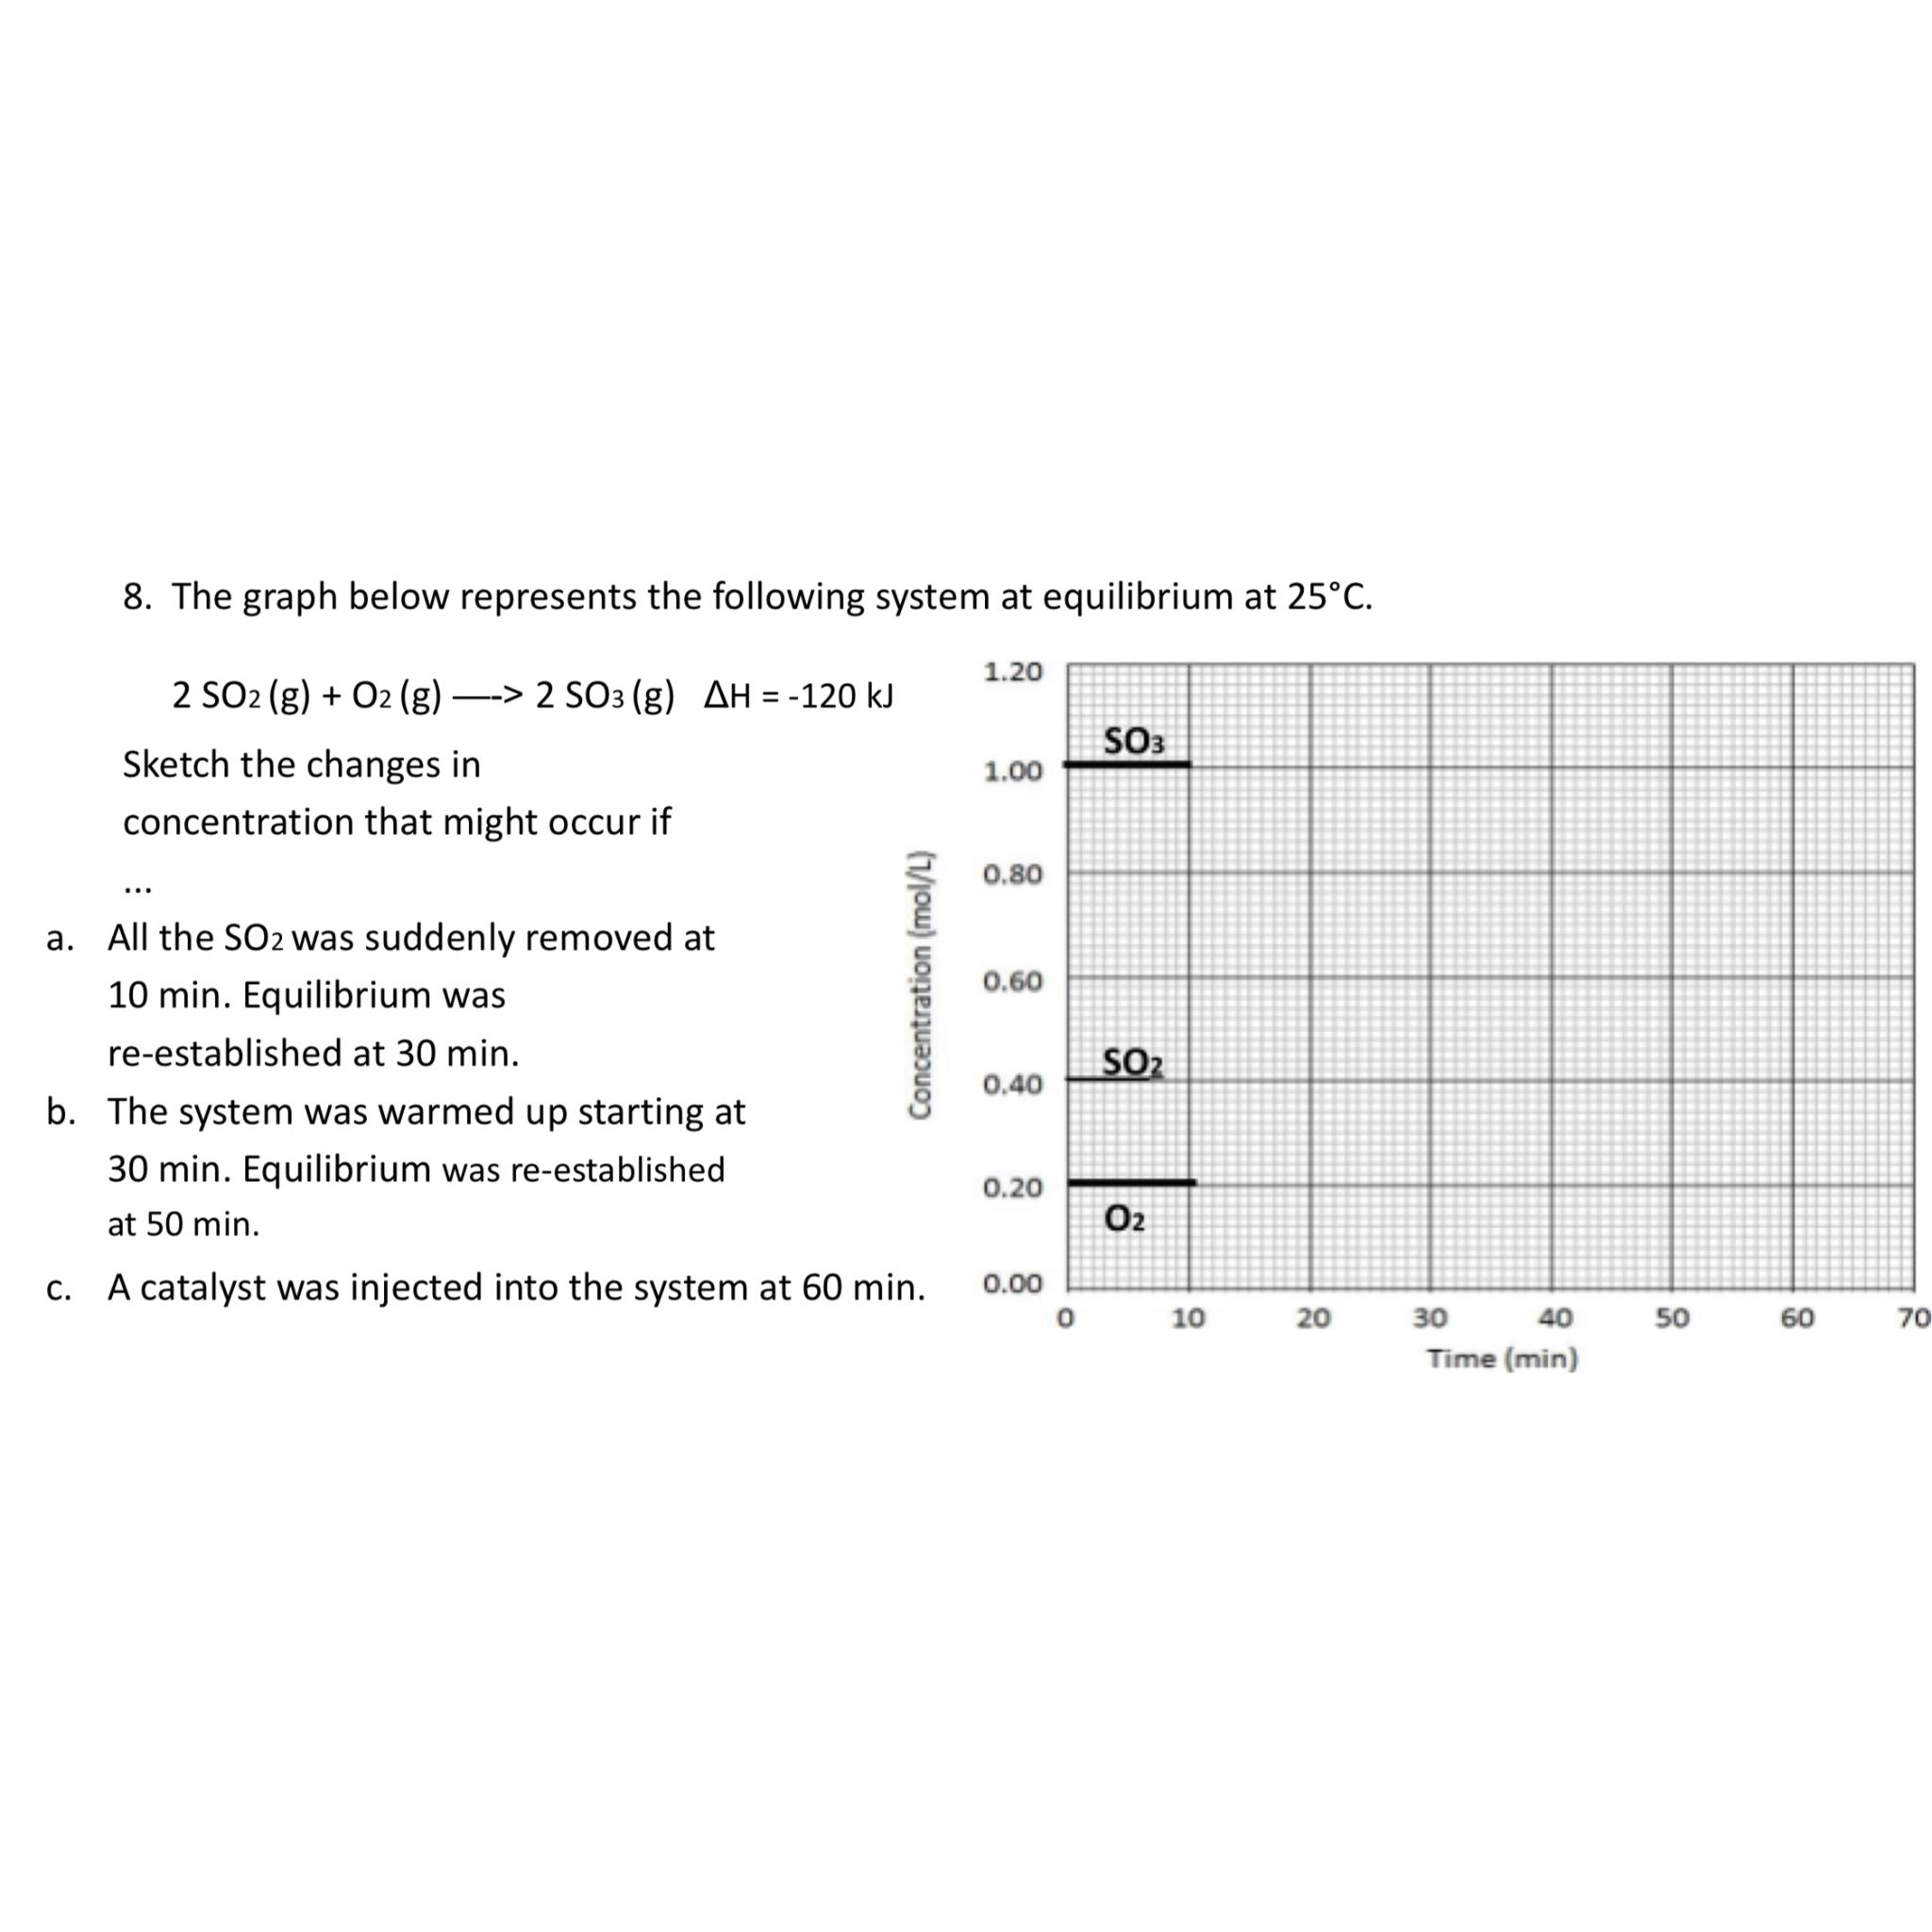
Question: The graph below represents the following system at equilibrium at 2 5 C . 2 S O 2 ( g ) + O 2 (
The graph below represents the following system at equilibrium at
Sketch the changes in concentration that might occur if
a All the was suddenly removed at min. Equilibrium was reestablished at min.
b The system was warmed up starting at min. Equilibrium was reestablished at min.
c A catalyst was injected into the system at min.
Step by Step Solution
There are 3 Steps involved in it
1 Expert Approved Answer
Step: 1 Unlock

Question Has Been Solved by an Expert!
Get step-by-step solutions from verified subject matter experts
Step: 2 Unlock
Step: 3 Unlock