

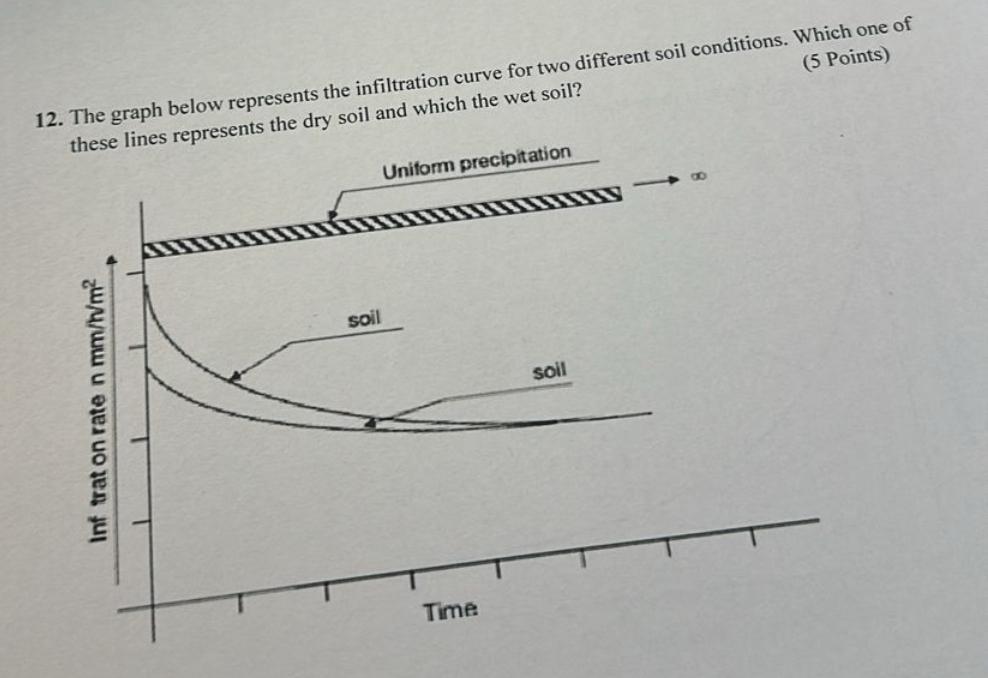
Question: The graph below represents the infiltration curve for two different soil conditions. Which one of ( 5 Points ) these lines represents the dry soil
The graph below represents the infiltration curve for two different soil conditions. Which one of Points these lines represents the dry soil and which the wet soil?
Step by Step Solution
There are 3 Steps involved in it
1 Expert Approved Answer
Step: 1 Unlock

Question Has Been Solved by an Expert!
Get step-by-step solutions from verified subject matter experts
Step: 2 Unlock
Step: 3 Unlock