

Question: The graph below represents the market for loanable funds. First, who is represented by supply in the loanable funds market and who is represented by
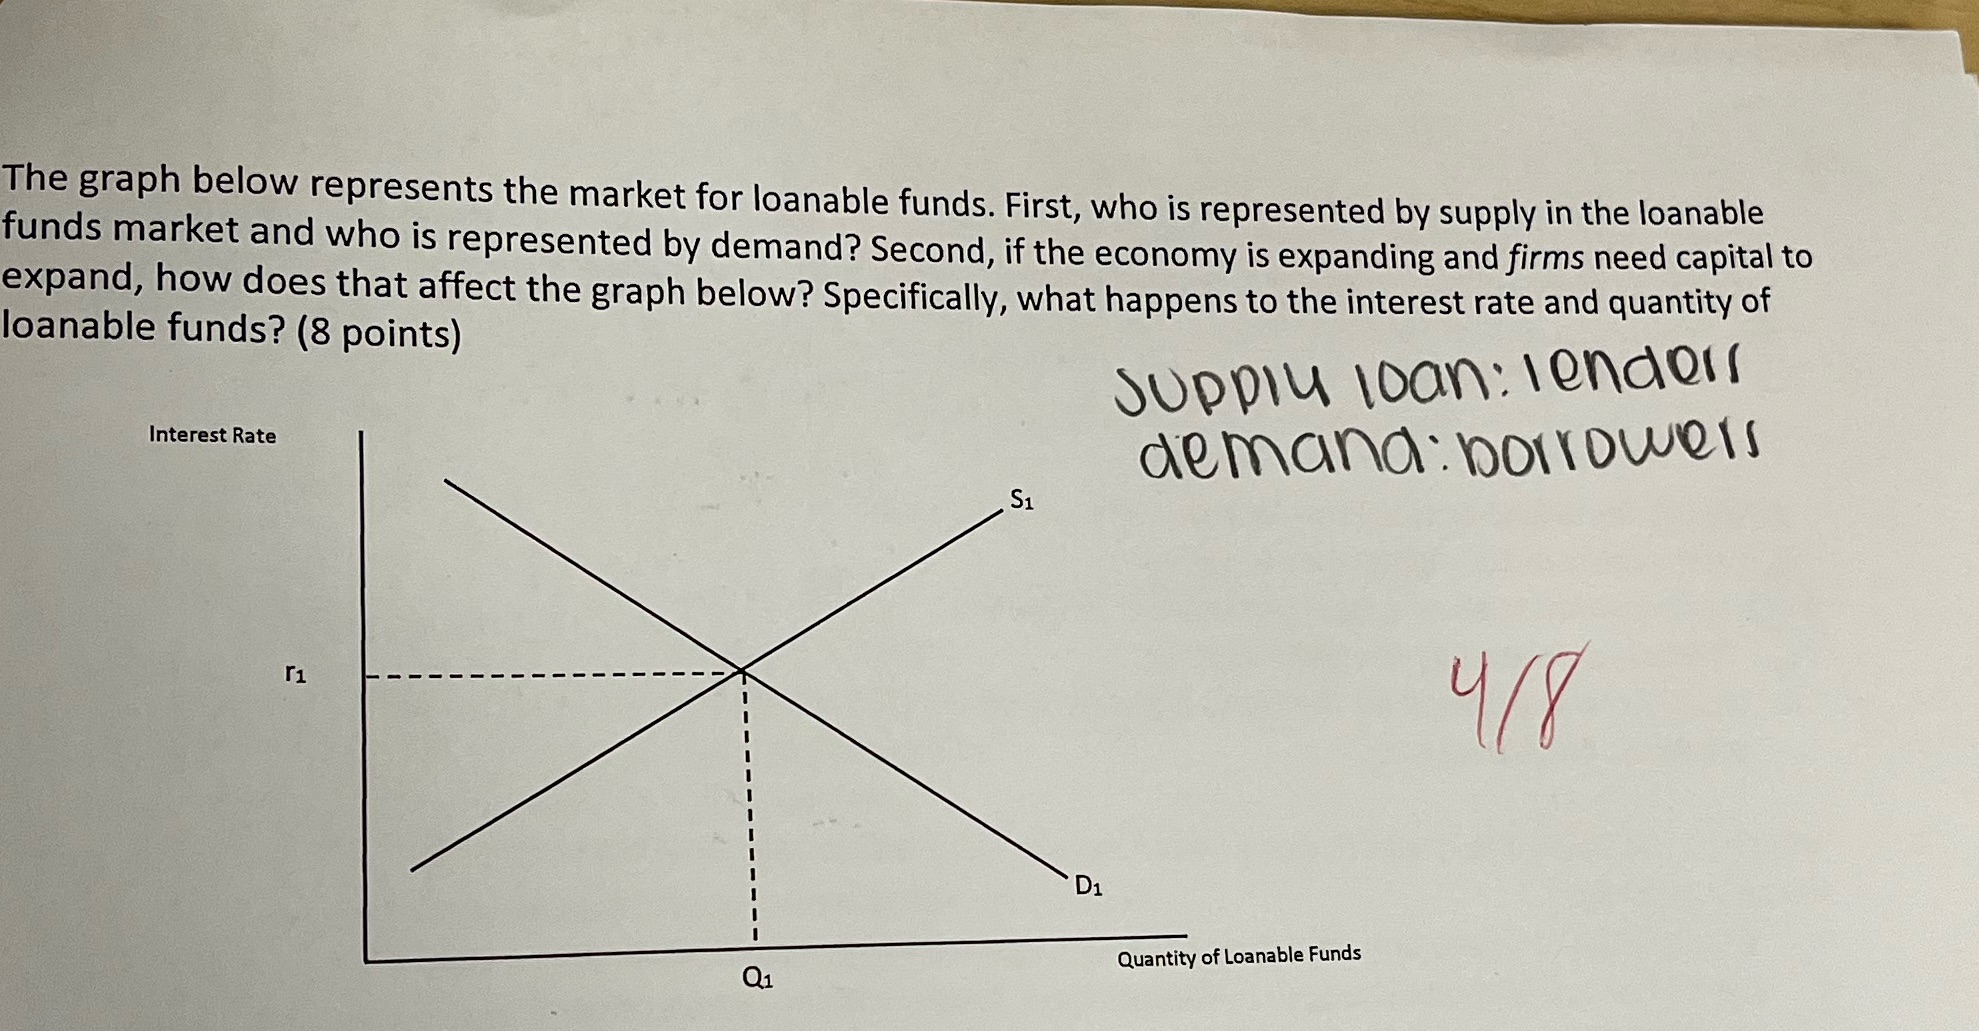
The graph below represents the market for loanable funds. First, who is represented by supply in the loanable funds market and who is represented by demand? Second, if the economy is expanding and firms need capital to expand, how does that affect the graph below? Specifically, what happens to the interest rate and quantity of loanable funds? (8 points) Supply loan: lenders Interest Rate demand: borrowers S1 r1 4/8 D1 Quantity of Loanable Funds Q1
Step by Step Solution
There are 3 Steps involved in it
1 Expert Approved Answer
Step: 1 Unlock

Question Has Been Solved by an Expert!
Get step-by-step solutions from verified subject matter experts
Step: 2 Unlock
Step: 3 Unlock