

Question: The graph below represents the relationship between t and v. Plot the vectors that represent the changes you computed in part (c). A tank contains
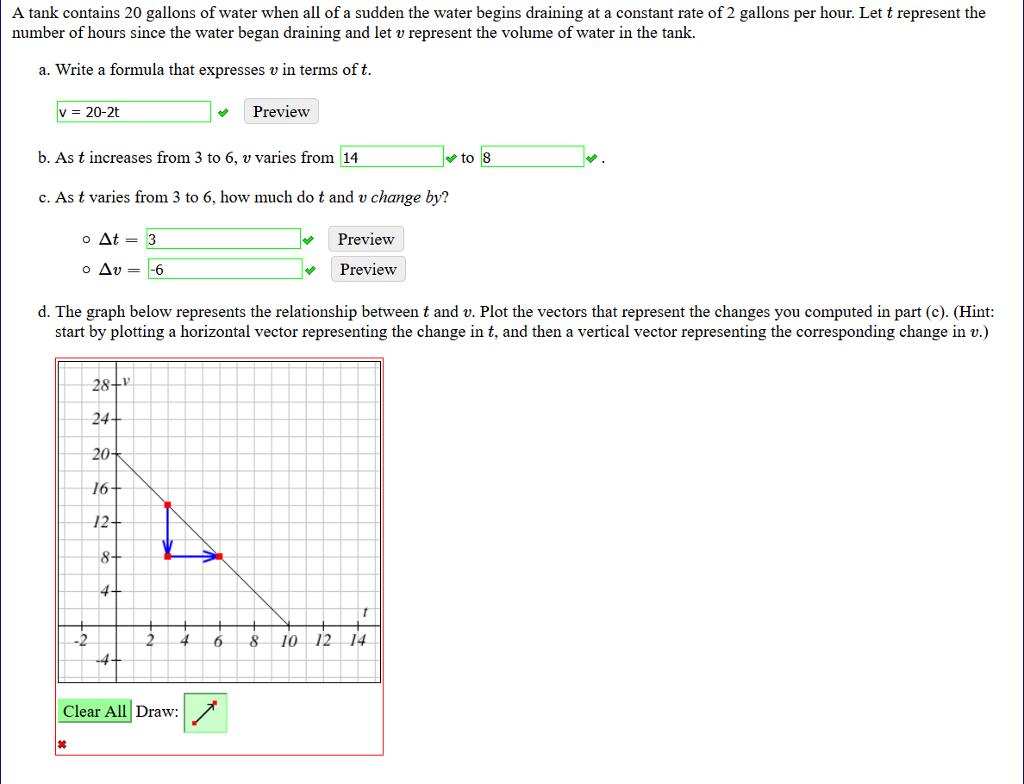
A tank contains 20 gallons of water when all of a sudden the water begins draining at a constant rate of 2 gallons per hour. Let t represent the number of hours since the water began draining and let v represent the volume of water in the tank. a. Write a formula that expresses v in terms of t. v = 20-2t Preview b. As t increases from 3 to 6, v varies from 14 v to 8 c. As t varies from 3 to 6, how much do t and v change by? o At = 3 Preview o Av = -6 Preview d. The graph below represents the relationship between t and v. Plot the vectors that represent the changes you computed in part (c). (Hint: start by plotting a horizontal vector representing the change in t, and then a vertical vector representing the corresponding change in v.) 28+v 24 20- 16+ 12- 8- 4- 10 12 14 Clear All Draw:
Step by Step Solution
3.47 Rating (160 Votes )
There are 3 Steps involved in it

Get step-by-step solutions from verified subject matter experts
Document Format (2 attachments)
63632e038a75b_235815.pdf
180 KBs PDF File
63632e038a75b_235815.docx
120 KBs Word File