

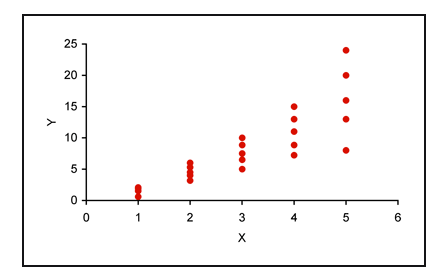
Question: The graph below shows a plot of data from an experiment that was designed to be analyzed by linear regression analysis. f
The graph below shows a plot of data from an experiment that was designed to be analyzed by linear regression analysis.
Step by Step Solution
There are 3 Steps involved in it
1 Expert Approved Answer
Step: 1 Unlock

Question Has Been Solved by an Expert!
Get step-by-step solutions from verified subject matter experts
Step: 2 Unlock
Step: 3 Unlock