

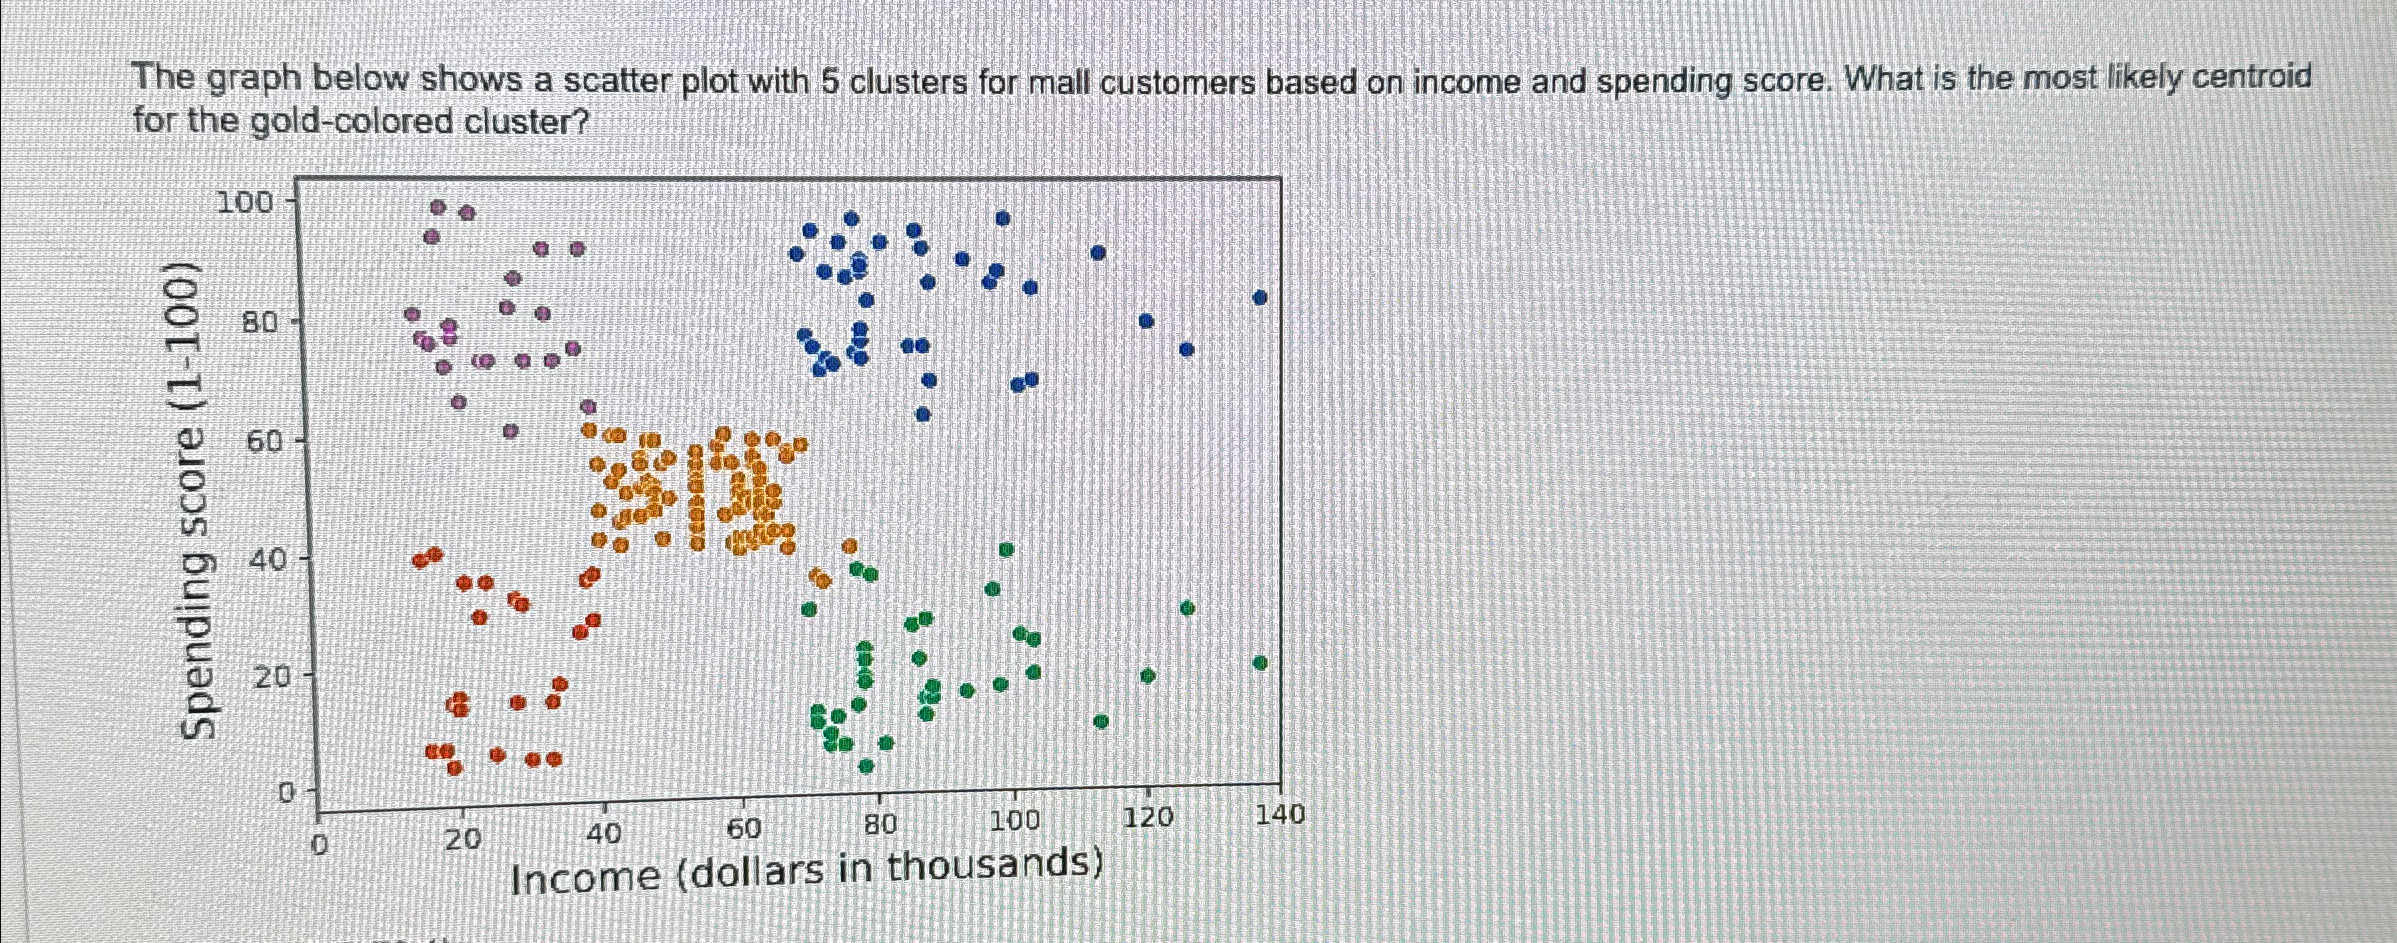
Question: The graph below shows a scatter plot with 5 clusters for mall customers based on income and spending score. What is the most likely centroid
The graph below shows a scatter plot with clusters for mall customers based on income and spending score. What is the most likely centroid for the goldcolored cluster?
Step by Step Solution
There are 3 Steps involved in it
1 Expert Approved Answer
Step: 1 Unlock

Question Has Been Solved by an Expert!
Get step-by-step solutions from verified subject matter experts
Step: 2 Unlock
Step: 3 Unlock