

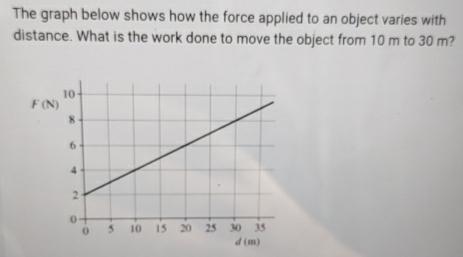
Question: The graph below shows how the force applied to an object varies with distance. What is the work done to move the object from 1
The graph below shows how the force applied to an object varies with distance. What is the work done to move the object from to
Step by Step Solution
There are 3 Steps involved in it
1 Expert Approved Answer
Step: 1 Unlock

Question Has Been Solved by an Expert!
Get step-by-step solutions from verified subject matter experts
Step: 2 Unlock
Step: 3 Unlock