

Question: The graph below shows points A, B, C and D, on the graph of y = f(x): 5+ D 3 2 B 2 C
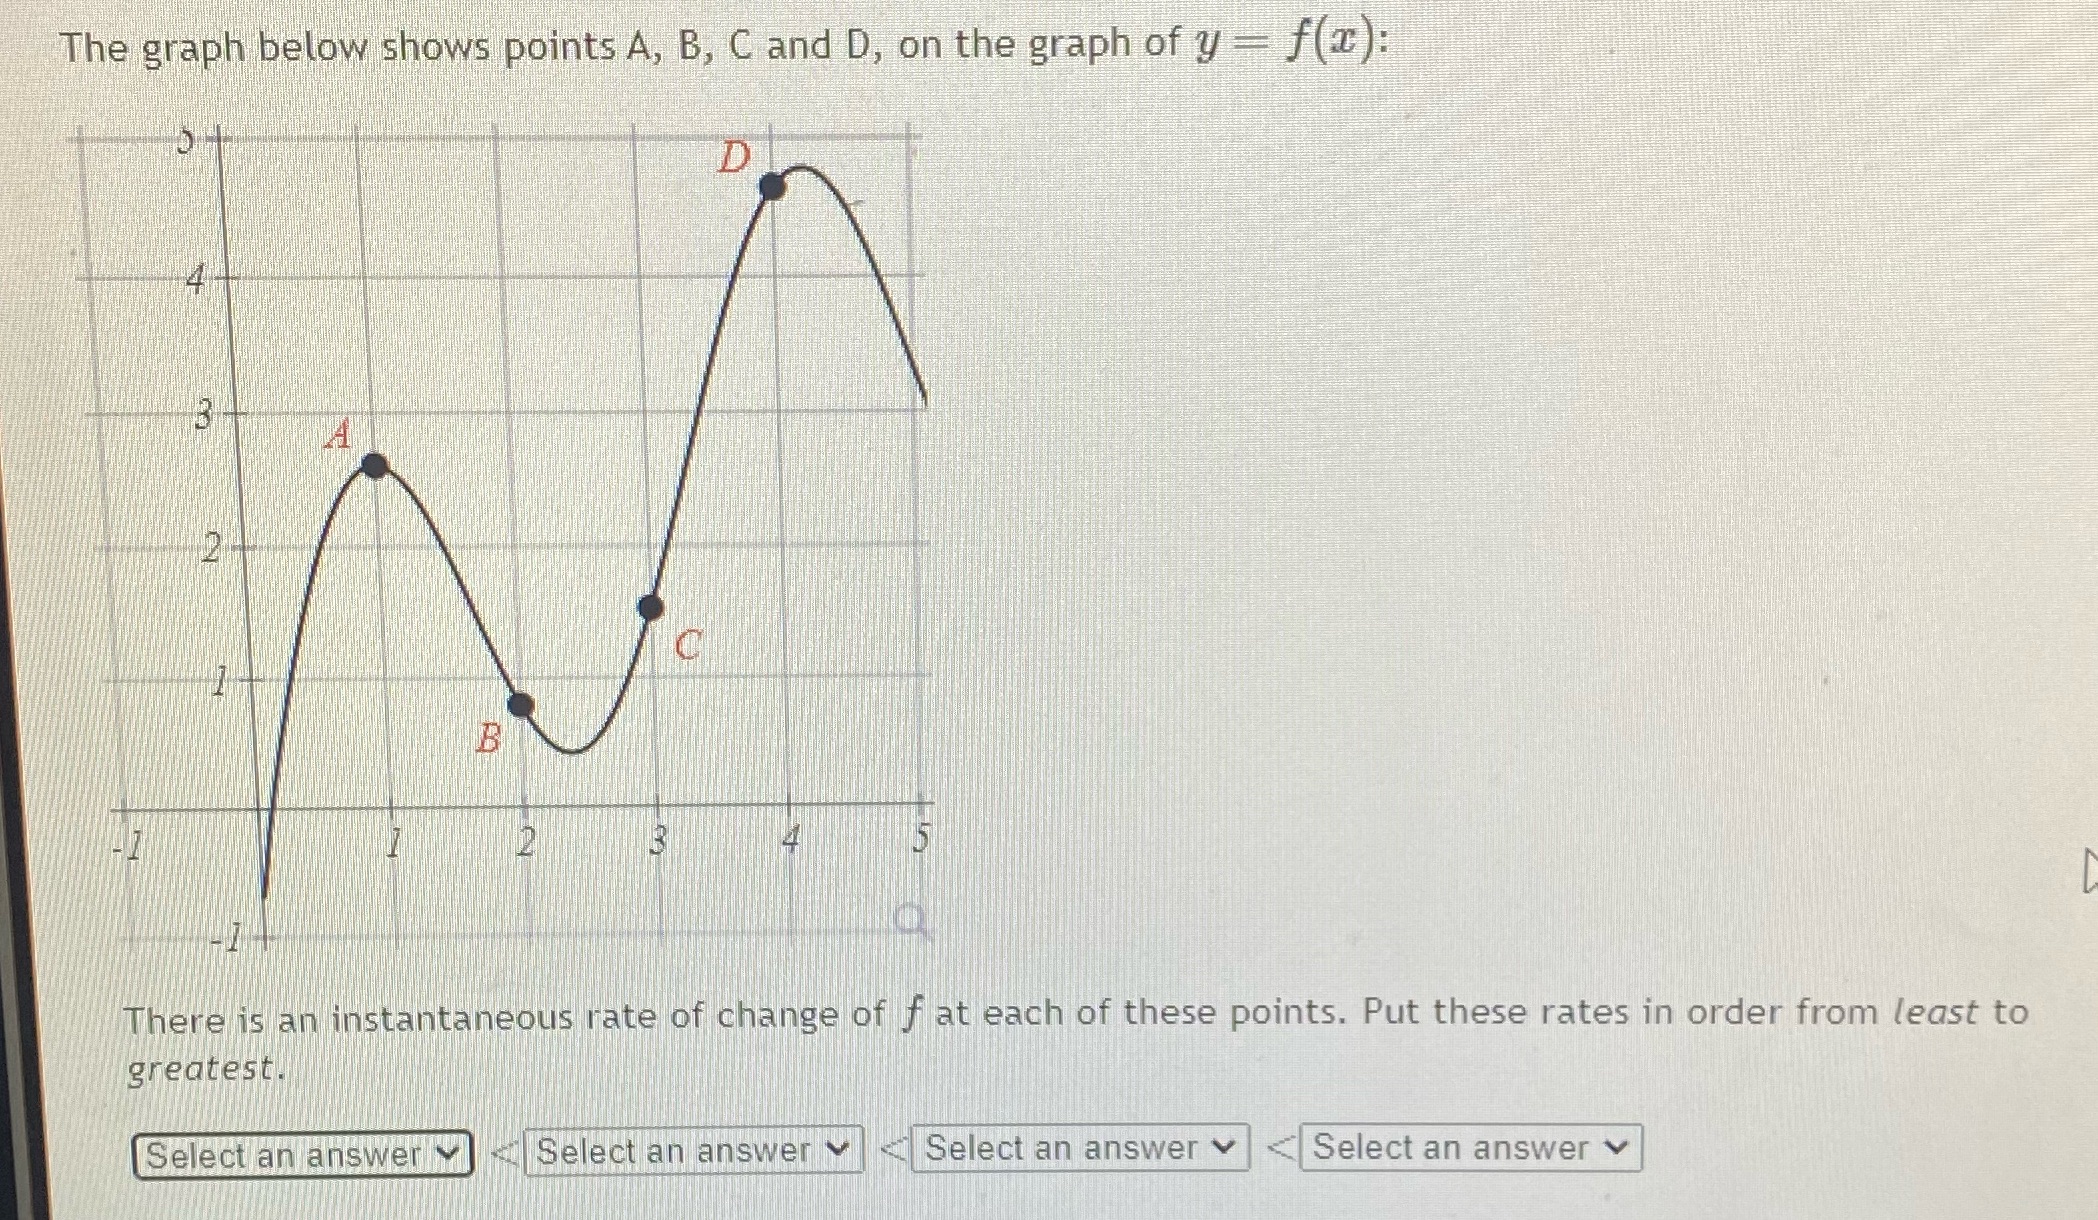
The graph below shows points A, B, C and D, on the graph of y = f(x): 5+ D 3 2 B 2 C 5 There is an instantaneous rate of change of f at each of these points. Put these rates in order from least to greatest. Select an answer Select an answer Select an answer Select an answer
Step by Step Solution
There are 3 Steps involved in it
1 Expert Approved Answer
Step: 1 Unlock

Question Has Been Solved by an Expert!
Get step-by-step solutions from verified subject matter experts
Step: 2 Unlock
Step: 3 Unlock