

The graph below shows supply and demand curves for annual medical office visits. Using this graph, answer
Question:
The graph below shows supply and demand curves for annual medical office visits. Using this graph, answer the questions below.
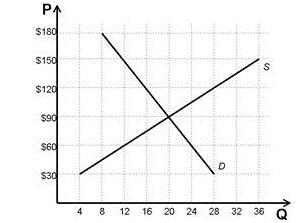
a. If the market were free from government regulation, what would be the equilibrium price and quantity?
b. Calculate total expenditures on office visits with this equilibrium price and quantity.
c. If the government subsidized office visits and required that all consumers were to pay $30 per visit no matter what the actual cost, how many visits would consumers demand?
d. What payment per visit would doctors require in order to supply that quantity of visits?
e. Calculate total expenditures on office visits under the condition of this $30 co-payment.
f. How do total expenditures with a co-payment of $30 compare to total expenditures without government involvement? Provide a numerical answer.
Expert Answer:


Financial Algebra advanced algebra with financial applications
ISBN: 978-0538449670
1st edition
Authors: Robert K. Gerver
