

Question: The graph below shows the angular velocity o as a function of time t for a point on a rotating object. 2.5 1.5 0.5
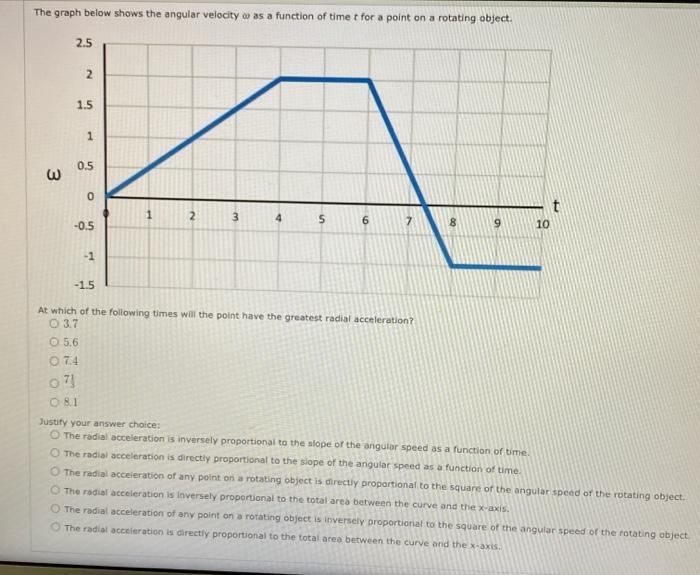
The graph below shows the angular velocity o as a function of time t for a point on a rotating object. 2.5 1.5 0.5 3. -0.5 8. 6. 10 -1 -1.5 At which of the following times will the point have the greatest radial acceleration? O 3.7 O 5.6 074 O 81 Justify your answer choice: O The radial acceieration is inversely proportional to the slope of the angular speed as a function of time. O The radial acceleration is directiy proportional to the siope of the angular speed as a function of time. O The radial acceieration of any point on a rotating object is directly proportional to the square of the angular speed of the rotating object. O The radial acceleration is inversely proportional to the total area between the curve and the x-axis. O The radial acceleration of any point on a rotating object is inversely proportional to the square of the angular speed of the rotating object. O The radial acceleration is directly proportional to the total area between the curve and the x-axis. 2. 1. 3
Step by Step Solution
3.37 Rating (150 Votes )
There are 3 Steps involved in it

Get step-by-step solutions from verified subject matter experts