

Question: The graph below shows the change in passenger load factor for all scheduled airlines in the United States over different months of a year. Passenger
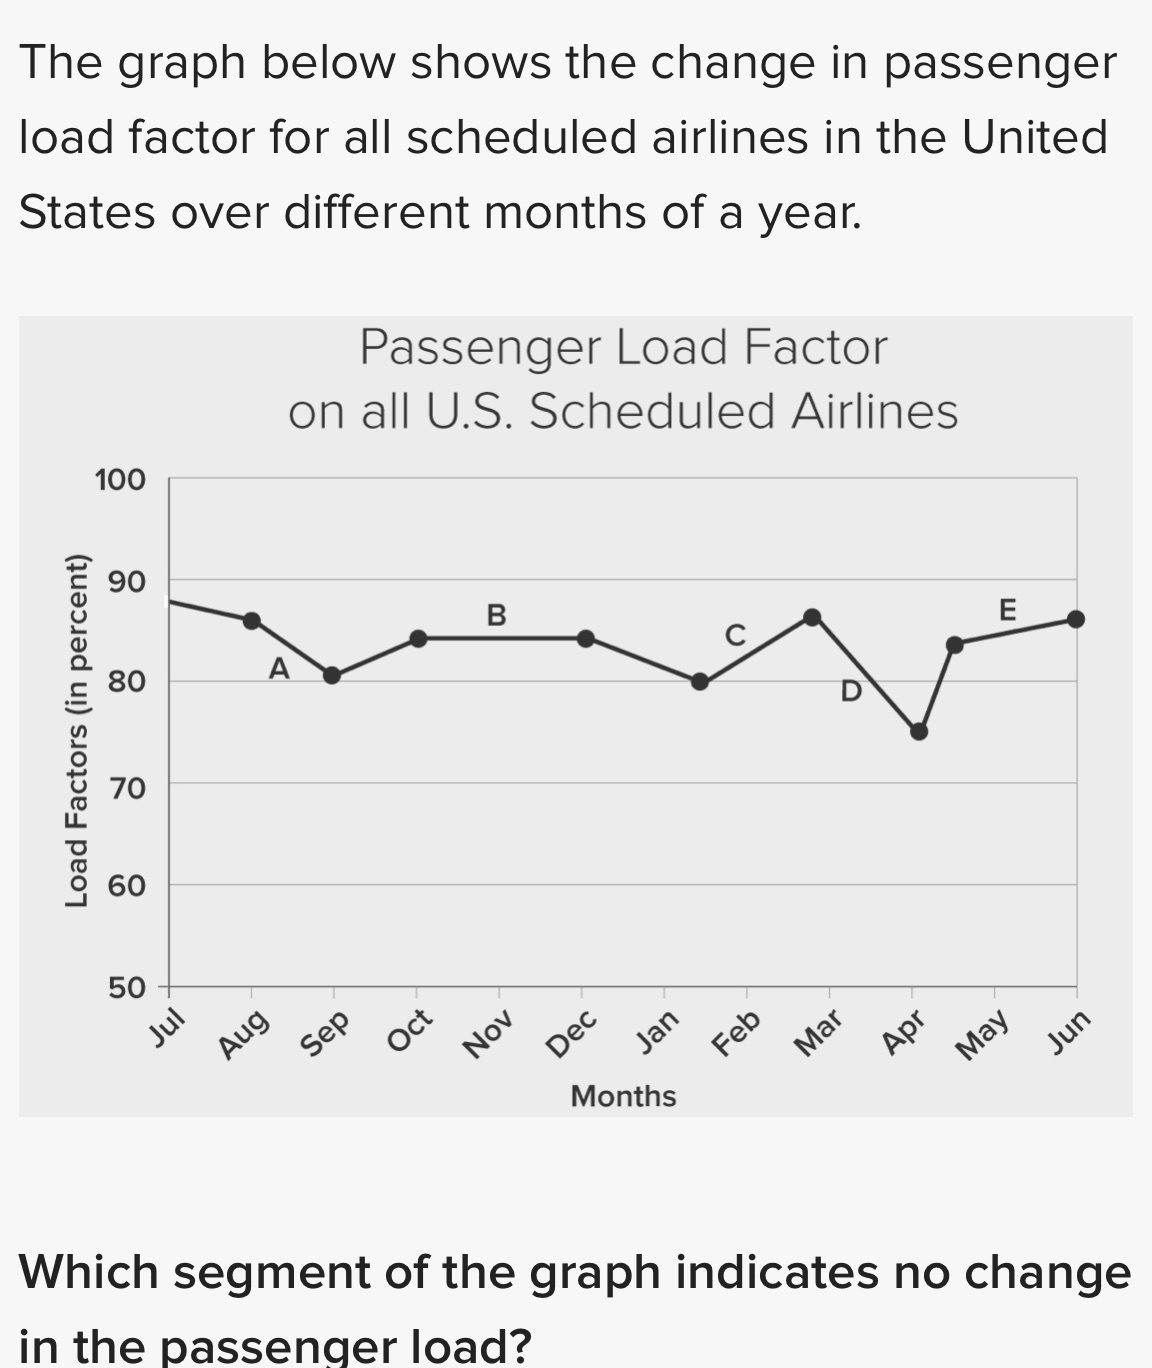
The graph below shows the change in passenger load factor for all scheduled airlines in the United States over different months of a year. Passenger Load Factor on all US. Scheduled Airlines 100 0 0 oo 0 \\l O Load Factors (in percent) 0': O 01 O Which segment of the graph indicates no change in the passenger load
Step by Step Solution
There are 3 Steps involved in it
1 Expert Approved Answer
Step: 1 Unlock

Question Has Been Solved by an Expert!
Get step-by-step solutions from verified subject matter experts
Step: 2 Unlock
Step: 3 Unlock