

Question: The graph below shows the marginal revenue function R'(x) where x is the quantity of products sold. R'Lr} a) What is the domain of the

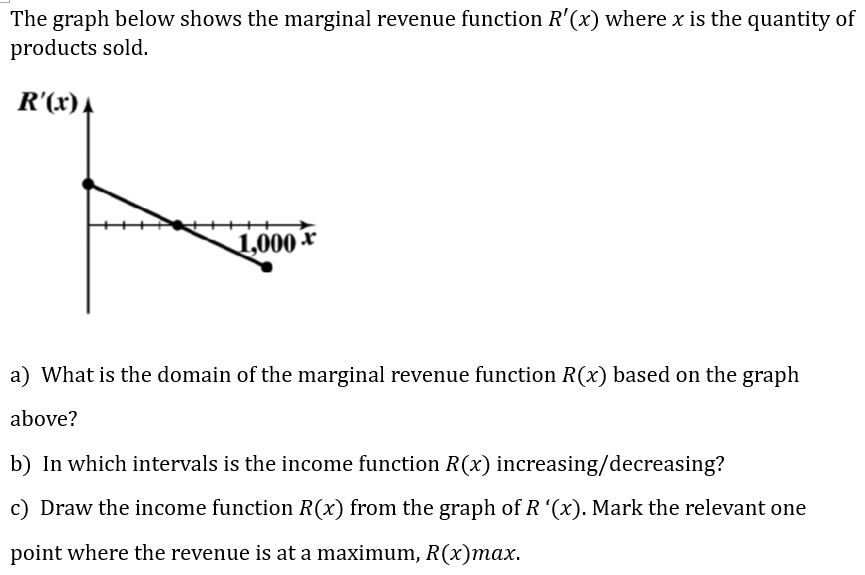
The graph below shows the marginal revenue function R'(x) where x is the quantity of products sold. R'Lr} a) What is the domain of the marginal revenue function R(x) based on the graph above? b) In which intervals is the income function R05) increasing/decreasing? c) Draw the income function R(x) from the graph OH? '(x). Mark the relevant one point where the revenue is at a maximum, R(x)max
Step by Step Solution
There are 3 Steps involved in it
1 Expert Approved Answer
Step: 1 Unlock

Question Has Been Solved by an Expert!
Get step-by-step solutions from verified subject matter experts
Step: 2 Unlock
Step: 3 Unlock