

Question: The graph below shows the position on a line at an ebiect plotted against time. Use the graph marked quld). You will find it much

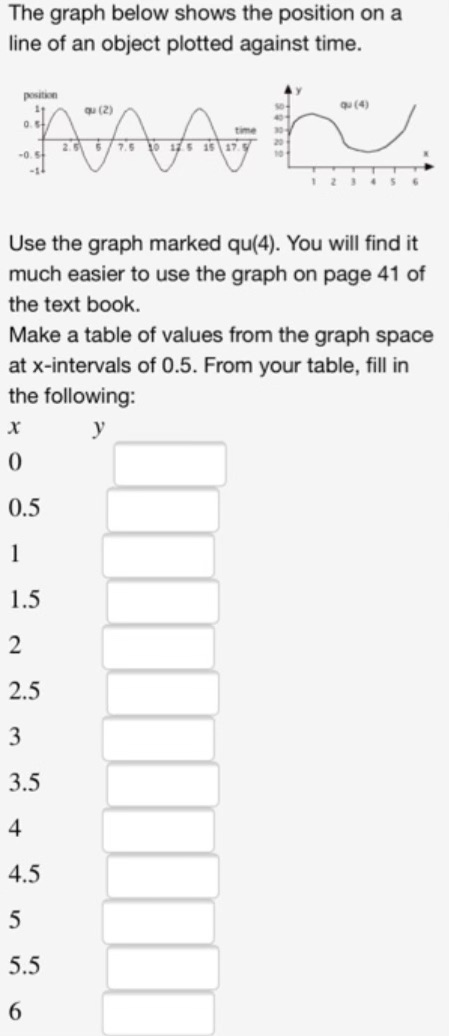
The graph below shows the position on a line at an ebiect plotted against time. Use the graph marked quld). You will find it much easier to use the graph on page 41 of the text book. Make a table of values from the graph spam at x-intenrals of 0.5. From you table. ll in the following: I y D 0.5 l 1.5 2 2.5
Step by Step Solution
There are 3 Steps involved in it
1 Expert Approved Answer
Step: 1 Unlock

Question Has Been Solved by an Expert!
Get step-by-step solutions from verified subject matter experts
Step: 2 Unlock
Step: 3 Unlock