

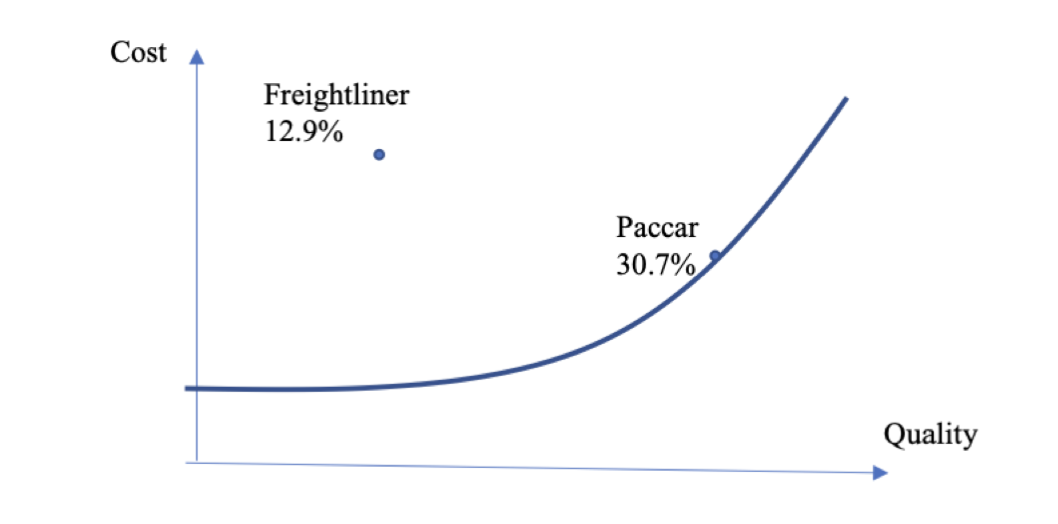
Question: The graph below shows the quality / cost combination and corresponding market share of different brands in the U . S . truck market. -
The graph below shows the qualitycost combination and corresponding market share of different brands in the US truck market.
it seems that, to some extent, Paccar has both cost advantage and benefit advantage. According to Michael Porters Theory of Competitive Advantage, a firm that pursues two advantages at the same time will become stuck in the middle How can a firm do well in both dimensions?
Step by Step Solution
There are 3 Steps involved in it
1 Expert Approved Answer
Step: 1 Unlock

Question Has Been Solved by an Expert!
Get step-by-step solutions from verified subject matter experts
Step: 2 Unlock
Step: 3 Unlock