

Question: The graph below shows the rate at which a bacteria population grows over a period of time (in days) when it was observed in the


![= (30.2?5} 2G0 H = [2 0,180) 150 Q = (13,150) 10!]](https://s3.amazonaws.com/si.experts.images/answers/2024/06/666378e0e1fb2_040666378e0cdb03.jpg)
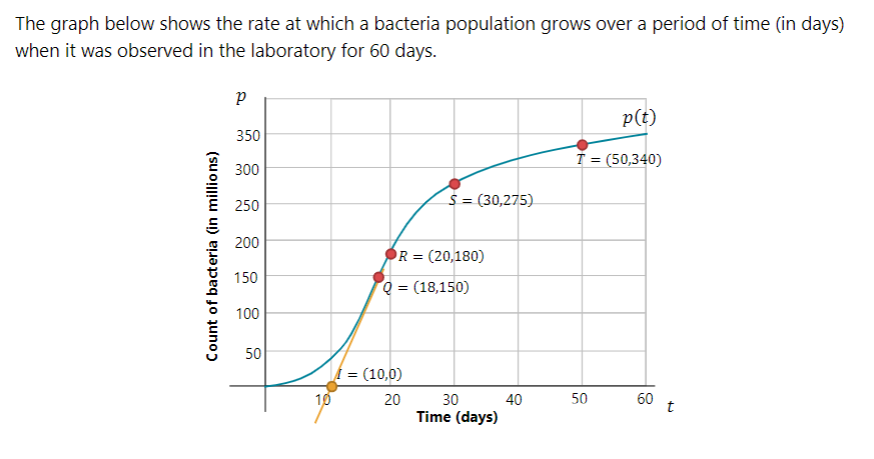
The graph below shows the rate at which a bacteria population grows over a period of time (in days) when it was observed in the laboratory for 60 days. Mr) T = (50,340) 250 5 = (30.2?5} 2G0 H = [2 0,180) 150 Q = (13,150) 10!] Count of bacteria (In millions) L.|'1 O .1": {15,0} 1521 20 30 4D 50 50 t .' Time {days} a. Compute the average rate of change of the population between: i . day 18 and day 20 ii. day 18 and day 30 iii. day 18 and day 50
Step by Step Solution
There are 3 Steps involved in it
1 Expert Approved Answer
Step: 1 Unlock

Question Has Been Solved by an Expert!
Get step-by-step solutions from verified subject matter experts
Step: 2 Unlock
Step: 3 Unlock