

Question: The graph can be made in any format Consider a monopolist facing the following situation: Quantity 0 10 20 30 40 50 60 70 Price
The graph can be made in any format
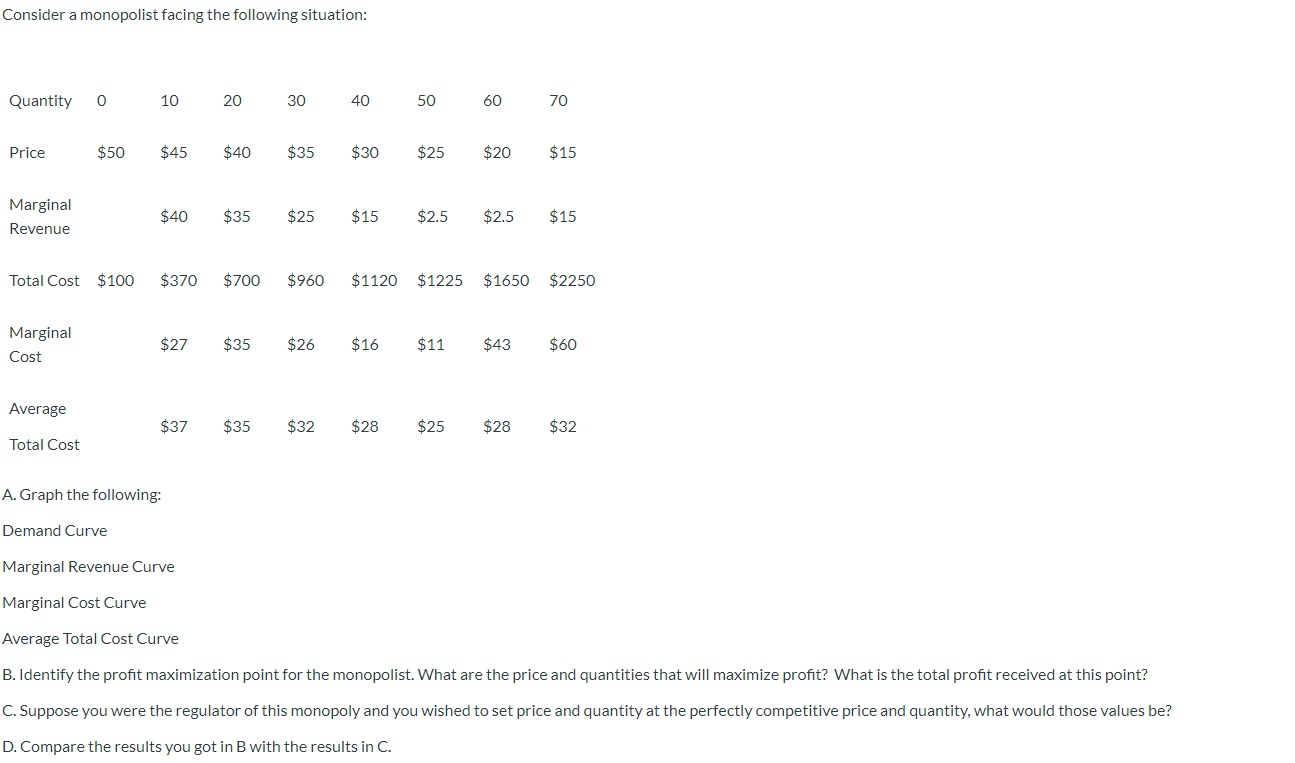
Consider a monopolist facing the following situation: Quantity 0 10 20 30 40 50 60 70 Price $50 $45 $40 $35 $30 $25 $20 $15 Marginal Revenue $40 $35 $25 $15 $2.5 $2.5 $15 Total Cost $100 $370 $700 $960 $1120 $1225 $1650 $2250 Marginal Cost $27 $35 $26 $16 $11 $43 $60 Average $37 $35 $32 $28 $25 $28 Total Cost $32 A. Graph the following: Demand Curve Marginal Revenue Curve Marginal Cost Curve Average Total Cost Curve B. Identify the profit maximization point for the monopolist. What are the price and quantities that will maximize profit? What is the total profit received at this point? C. Suppose you were the regulator of this monopoly and you wished to set price and quantity at the perfectly competitive price and quantity, what would those values be? D. Compare the results you got in B with the results in C
Step by Step Solution
There are 3 Steps involved in it

Get step-by-step solutions from verified subject matter experts