

Question: The graph given below shows the supply and demand curves for pounds of cheese in Wisconsin. Suppose the Market for Cheese in Wisconsin world price

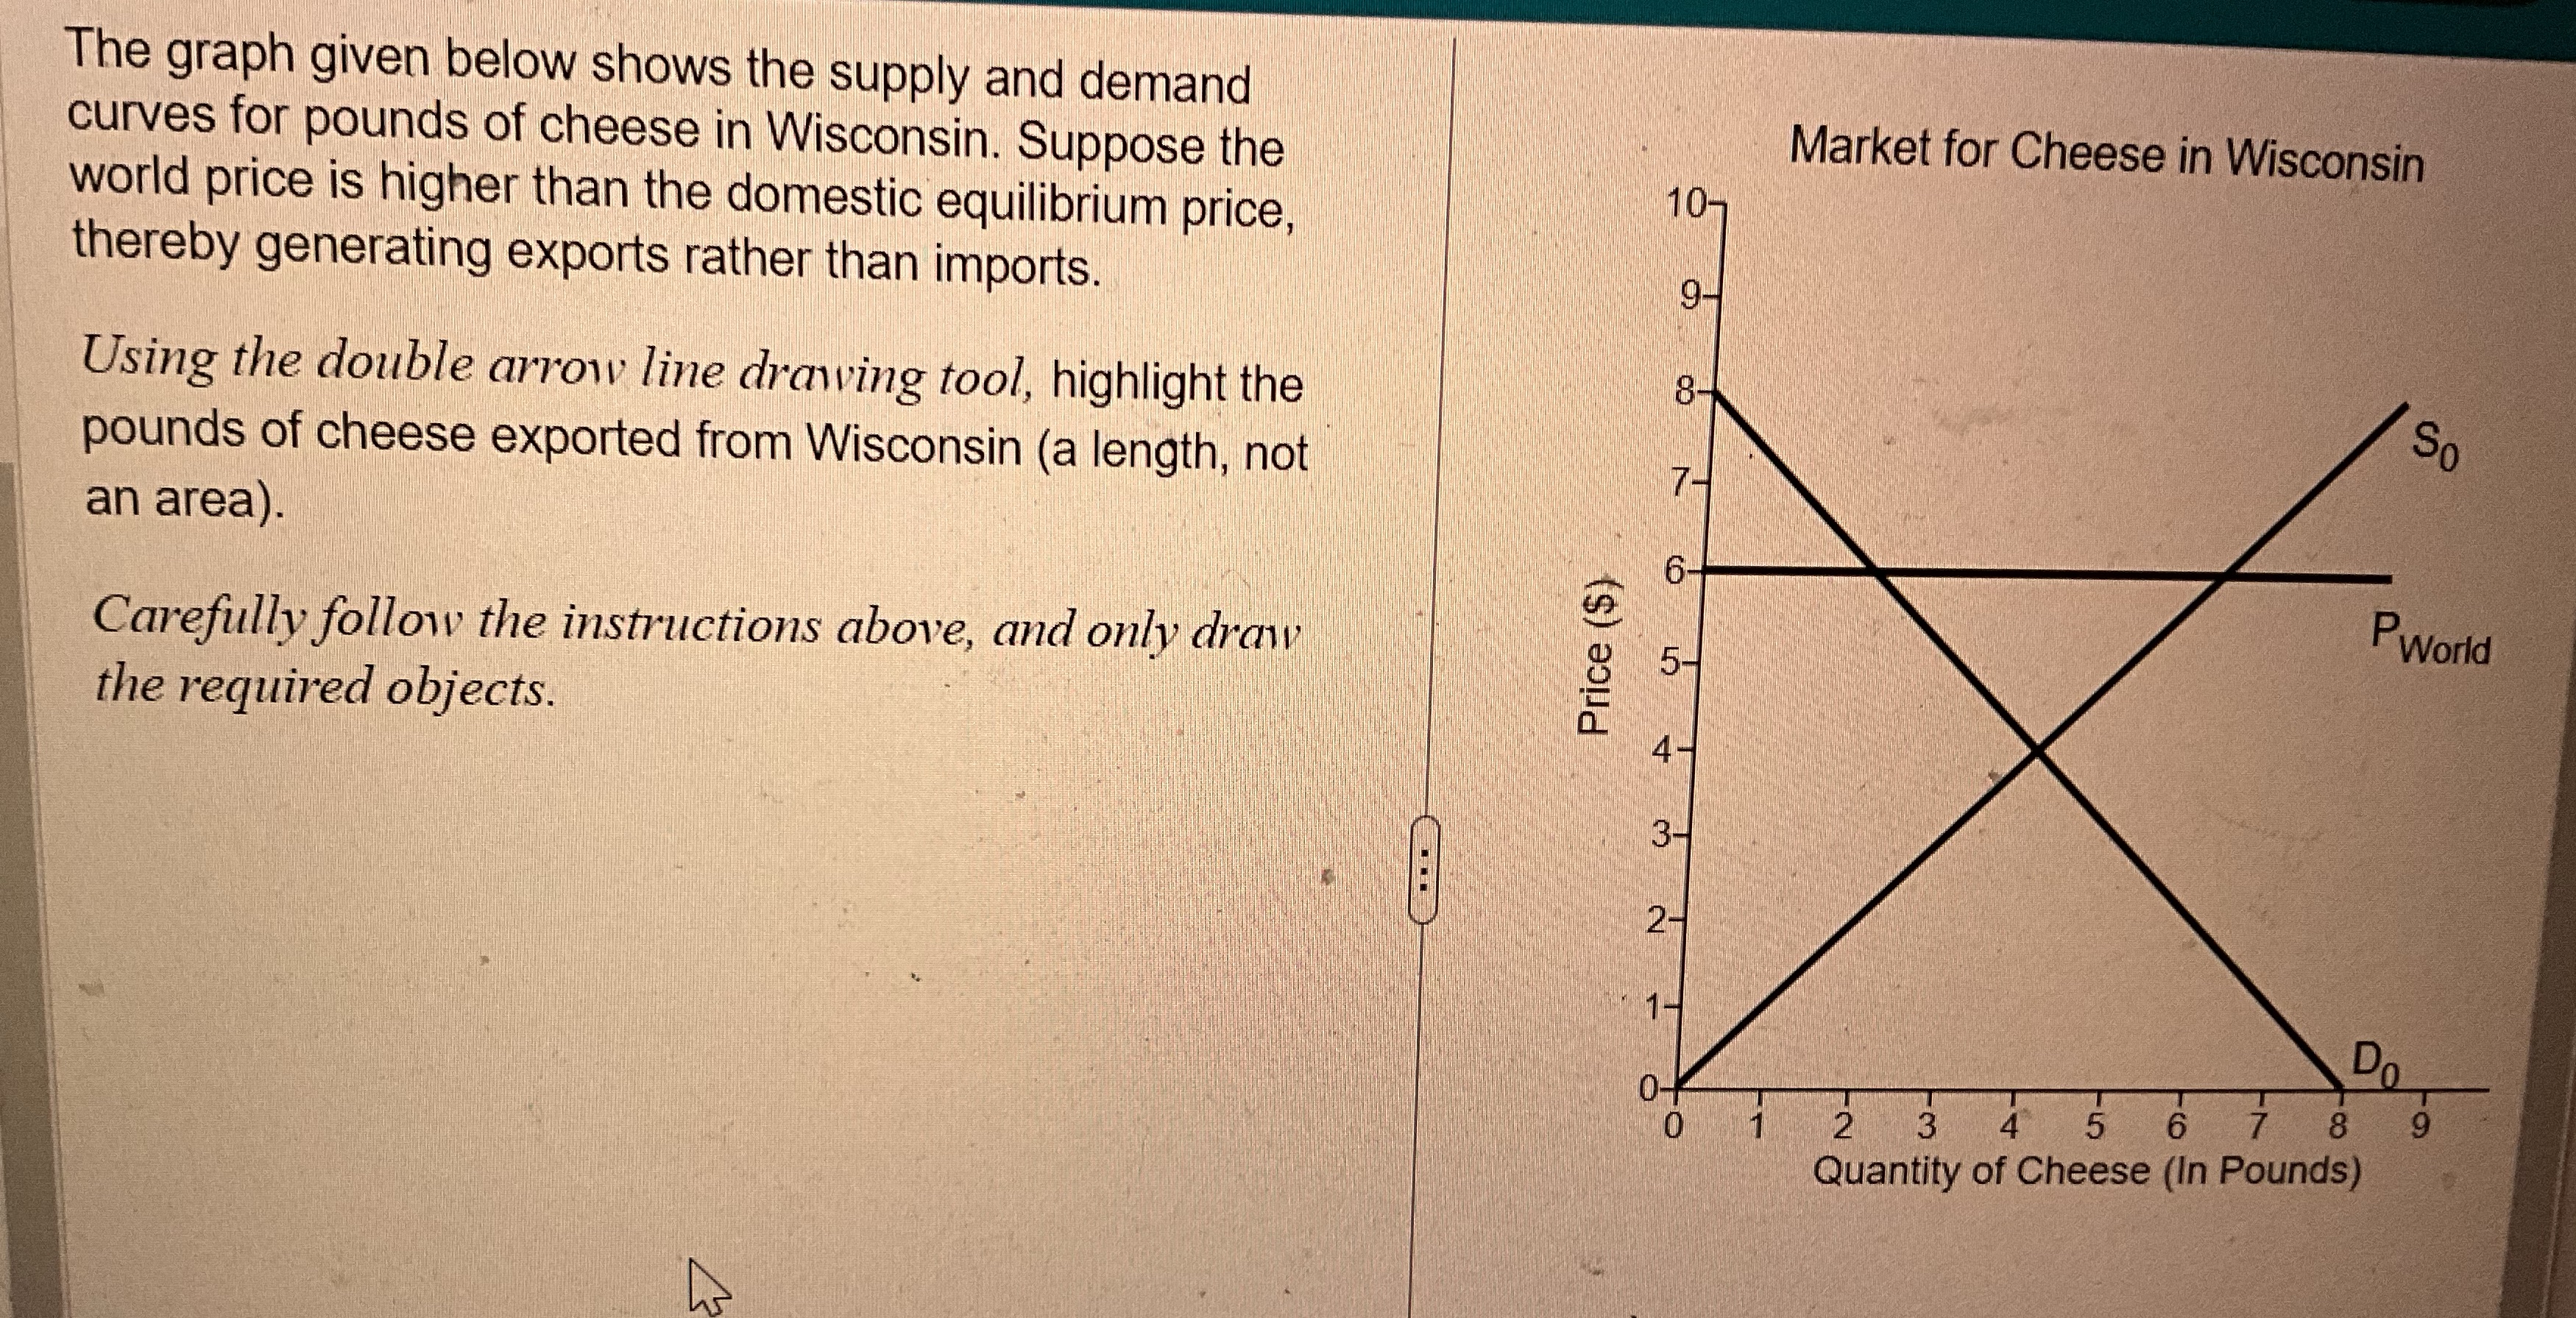
The graph given below shows the supply and demand curves for pounds of cheese in Wisconsin. Suppose the Market for Cheese in Wisconsin world price is higher than the domestic equilibrium price, thereby generating exports rather than imports. 9- Using the double arrow line drawing tool, highlight the 8- So pounds of cheese exported from Wisconsin (a length, not N an area). 6- Carefully follow the instructions above, and only draw PWorld Price ($) the required objects. Do 2 3 4 5 6 7 8 Quantity of Cheese (In Pounds)
Step by Step Solution
There are 3 Steps involved in it
1 Expert Approved Answer
Step: 1 Unlock

Question Has Been Solved by an Expert!
Get step-by-step solutions from verified subject matter experts
Step: 2 Unlock
Step: 3 Unlock