

Question: The graph illustrates an average total cost (ATC) curve (also sometimes called average cost), marginal cost (MC) curve, average variable cost (AVC) curve, and marginal
The graph illustrates an average total cost (ATC) curve (also sometimes called average cost), marginal cost (MC) curve, average variable cost (AVC) curve, and marginal revenue (MR) curve (which is also the market price) for a perfectly competitive firm that produces stuffed animals. Please answer the three questions, assuming that the firm is profit maximizing and does not shutdown in the shortrun.
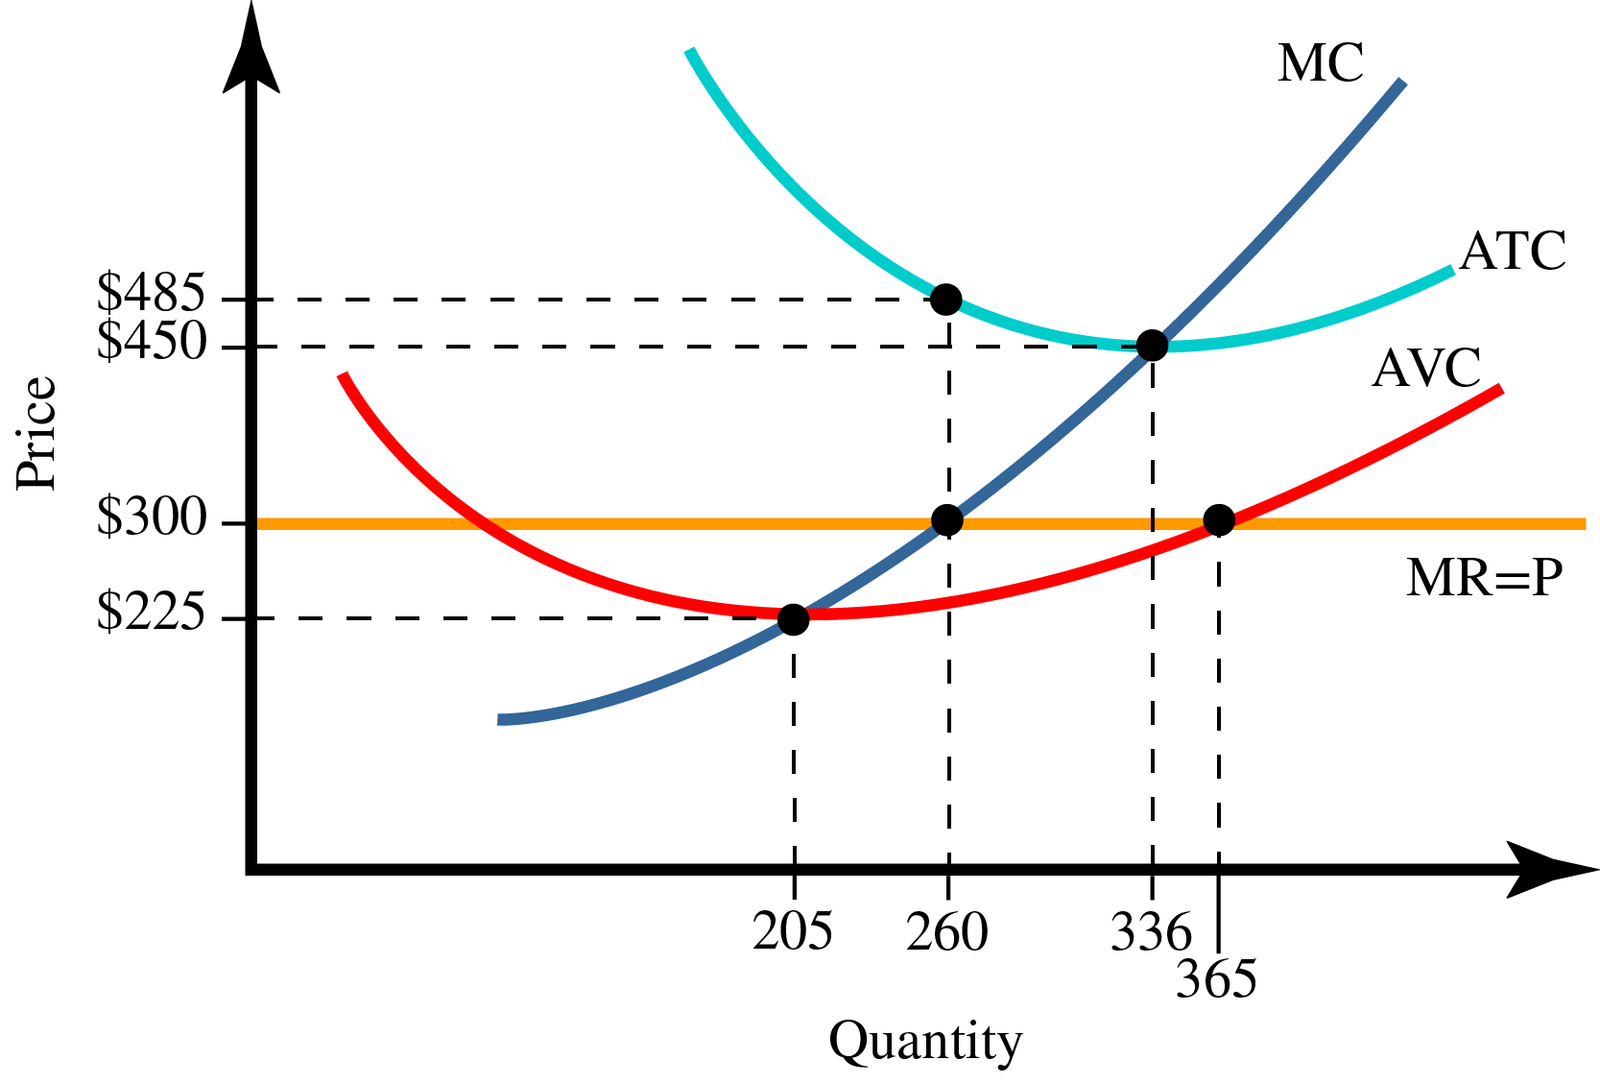
MC ATC $485 $450 AVC Price $300 MR=P $225 - - - - - - - - - - 205 260 336 365 Quantity
Step by Step Solution
There are 3 Steps involved in it
1 Expert Approved Answer
Step: 1 Unlock

Question Has Been Solved by an Expert!
Get step-by-step solutions from verified subject matter experts
Step: 2 Unlock
Step: 3 Unlock