

Question: The graph in Figure 2 contains the same information as Block 1 Figure 5 . 9 ( Block 1 , p . 7 9 )
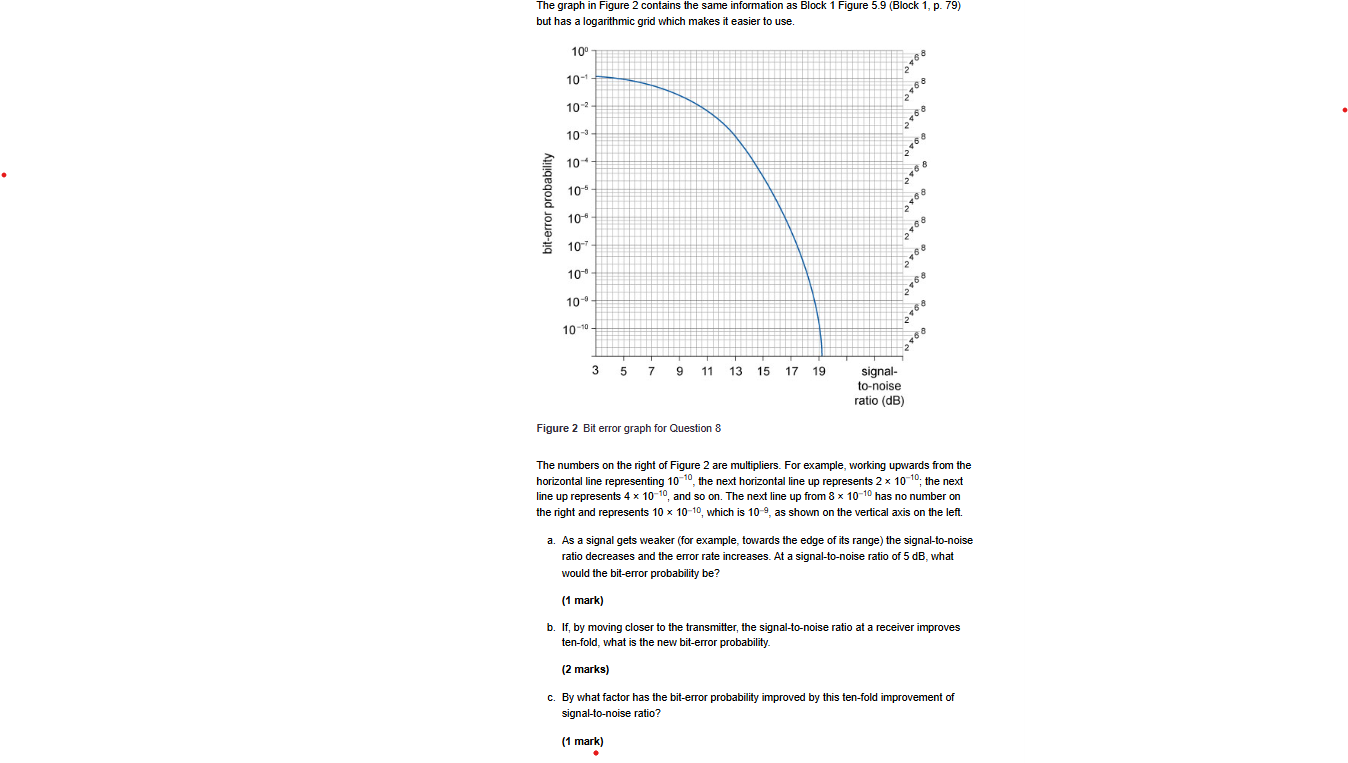
The graph in Figure contains the same information as Block Figure Block p but has a logarithmic grid which makes it easier to use.
Figure Bit error graph for Question
The numbers on the right of Figure are multipliers. For example, working upwards from the horizontal line representing the next horizontal line up represents times ; the next line up represents times and so on The next line up from times has no number on the right and represents times which is as shown on the vertical axis on the left.
a As a signal gets weaker for example, towards the edge of its range the signaltonoise ratio decreases and the error rate increases. At a signaltonoise ratio of dB what would the biterror probability be
mark
b If by moving closer to the transmitter, the signaltonoise ratio at a receiver improves tenfold, what is the new biterror probability.
marks
c By what factor has the biterror probability improved by this tenfold improvement of signaltonoise ratio?
mark
Step by Step Solution
There are 3 Steps involved in it
1 Expert Approved Answer
Step: 1 Unlock

Question Has Been Solved by an Expert!
Get step-by-step solutions from verified subject matter experts
Step: 2 Unlock
Step: 3 Unlock