

Question: The graph in the figure displays the sample sizes and percentages of people in different age and gender groups who were polled concerning their
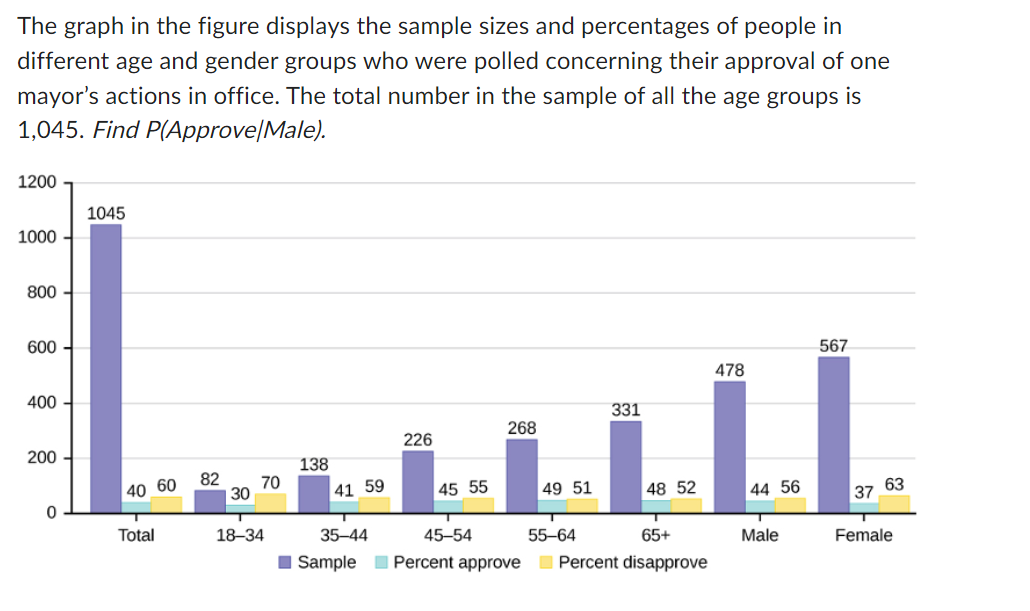
The graph in the figure displays the sample sizes and percentages of people in different age and gender groups who were polled concerning their approval of one mayor's actions in office. The total number in the sample of all the age groups is 1,045. Find P(Approve/Male). 1200 1000 800 600- 400 1045 567 478 331 268 226 200 138 40 60 82 70 30 41 59 45 55 49 51 48 52 44 56 63 37 0 Total 18-34 35-44 45-54 55-64 65+ Male Female Sample Percent approve Percent disapprove
Step by Step Solution
There are 3 Steps involved in it
Solutions The answer provided below has been developed in a clear step by step manner Step 1 Answers ... View full answer

Get step-by-step solutions from verified subject matter experts