

Question: The graph in the figure shows the current through a 1.0ohmresistor as a function of time. A. How much charge flowed through the resistor during
The graph in the figure shows the current through a 1.0ohmresistor as a function of time.
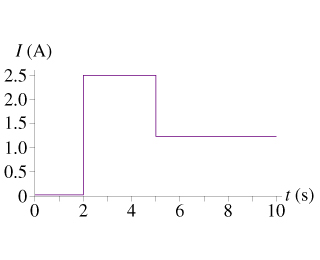
A.
How much charge flowed through the resistor during the 10 sinterval shown? (Answer in C)
B.
What was the total energy dissipated by the resistor during thistime? (Answer in J)
I (A) 2.5 2.0- 1.5- 1.0- 0.5- 0 0 2 4 6 8 -t (s) 10
Step by Step Solution
★★★★★
3.46 Rating (149 Votes )
There are 3 Steps involved in it
1 Expert Approved Answer
Step: 1 Unlock

Question Has Been Solved by an Expert!
Get step-by-step solutions from verified subject matter experts
Step: 2 Unlock
Step: 3 Unlock