

Question: The graph in this figure illustrates an initial competitive equilibrium in the market for sugar at the intersection of D 1 and S 2 (
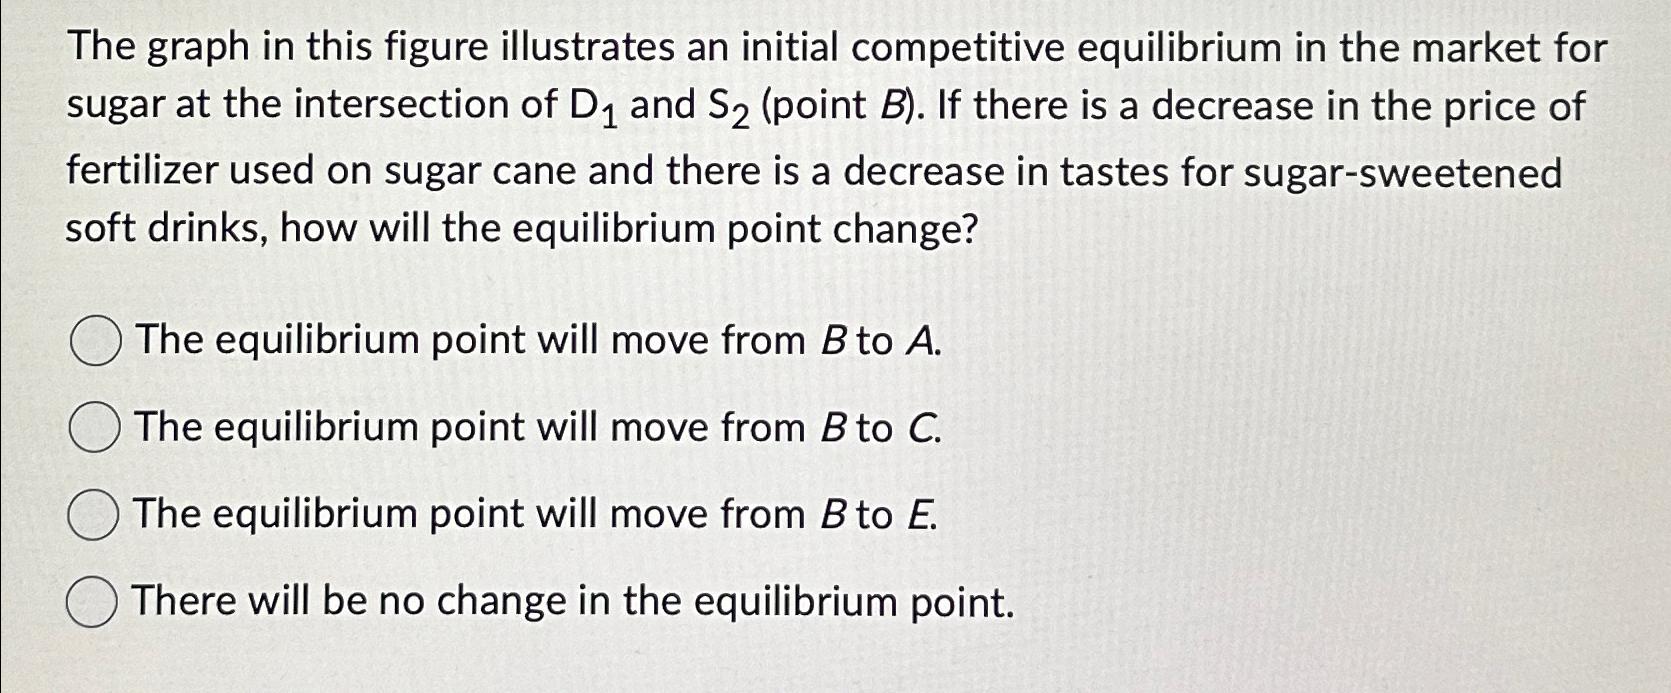
The graph in this figure illustrates an initial competitive equilibrium in the market for sugar at the intersection of and point If there is a decrease in the price of fertilizer used on sugar cane and there is a decrease in tastes for sugarsweetened soft drinks, how will the equilibrium point change?
The equilibrium point will move from to
The equilibrium point will move from to
The equilibrium point will move from to
There will be no change in the equilibrium point.
Step by Step Solution
There are 3 Steps involved in it
1 Expert Approved Answer
Step: 1 Unlock

Question Has Been Solved by an Expert!
Get step-by-step solutions from verified subject matter experts
Step: 2 Unlock
Step: 3 Unlock