

Question: The graph of a function fis given. Use the graph to estimate the following. (Enter your answers using interval notation.) (a) The domain and range
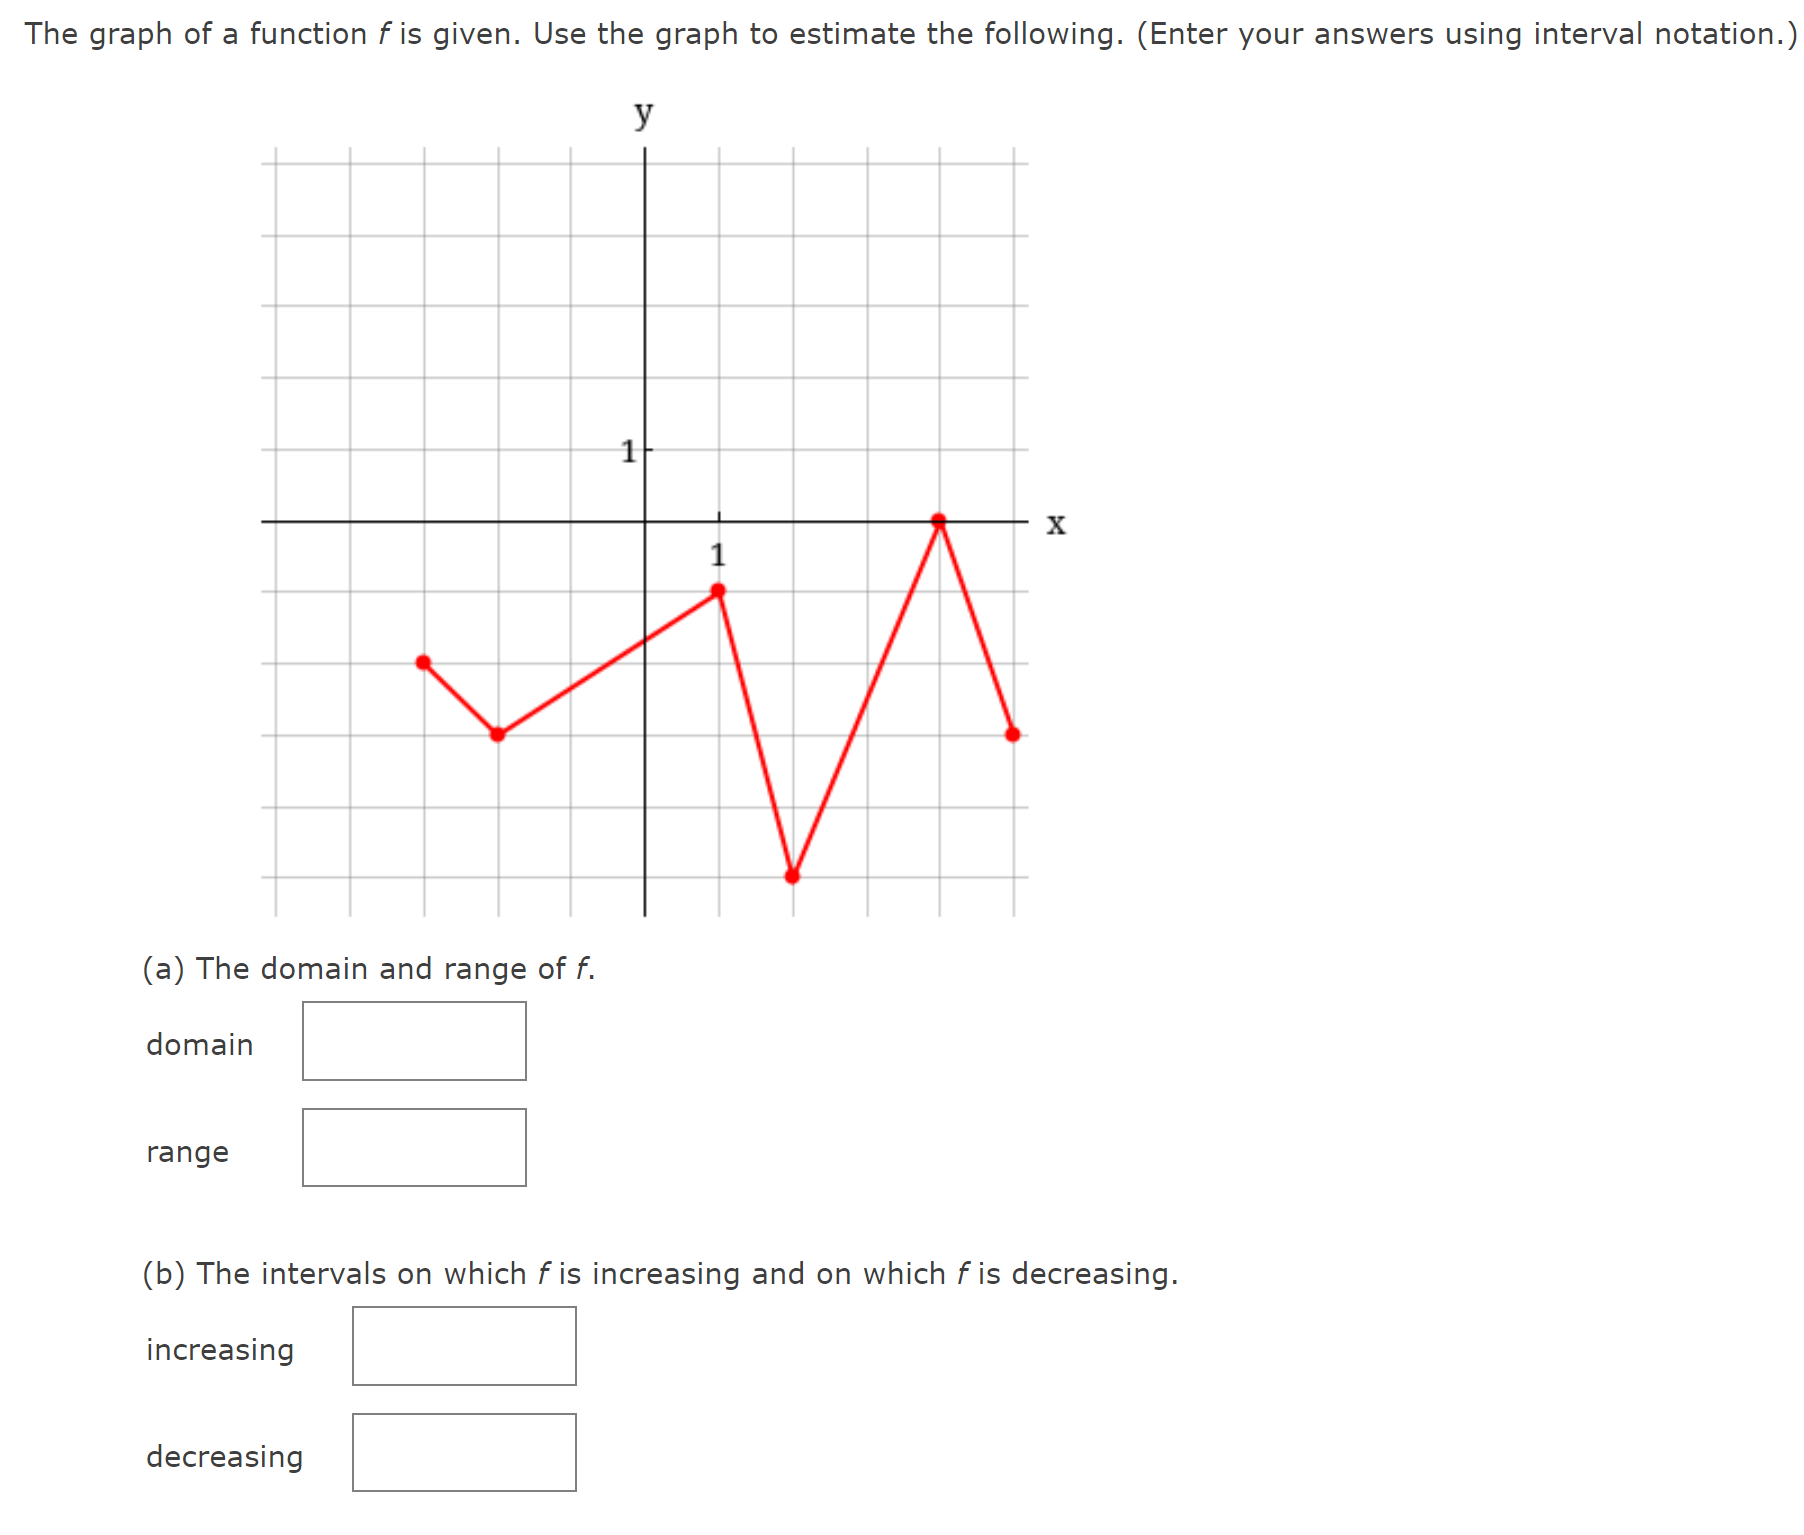
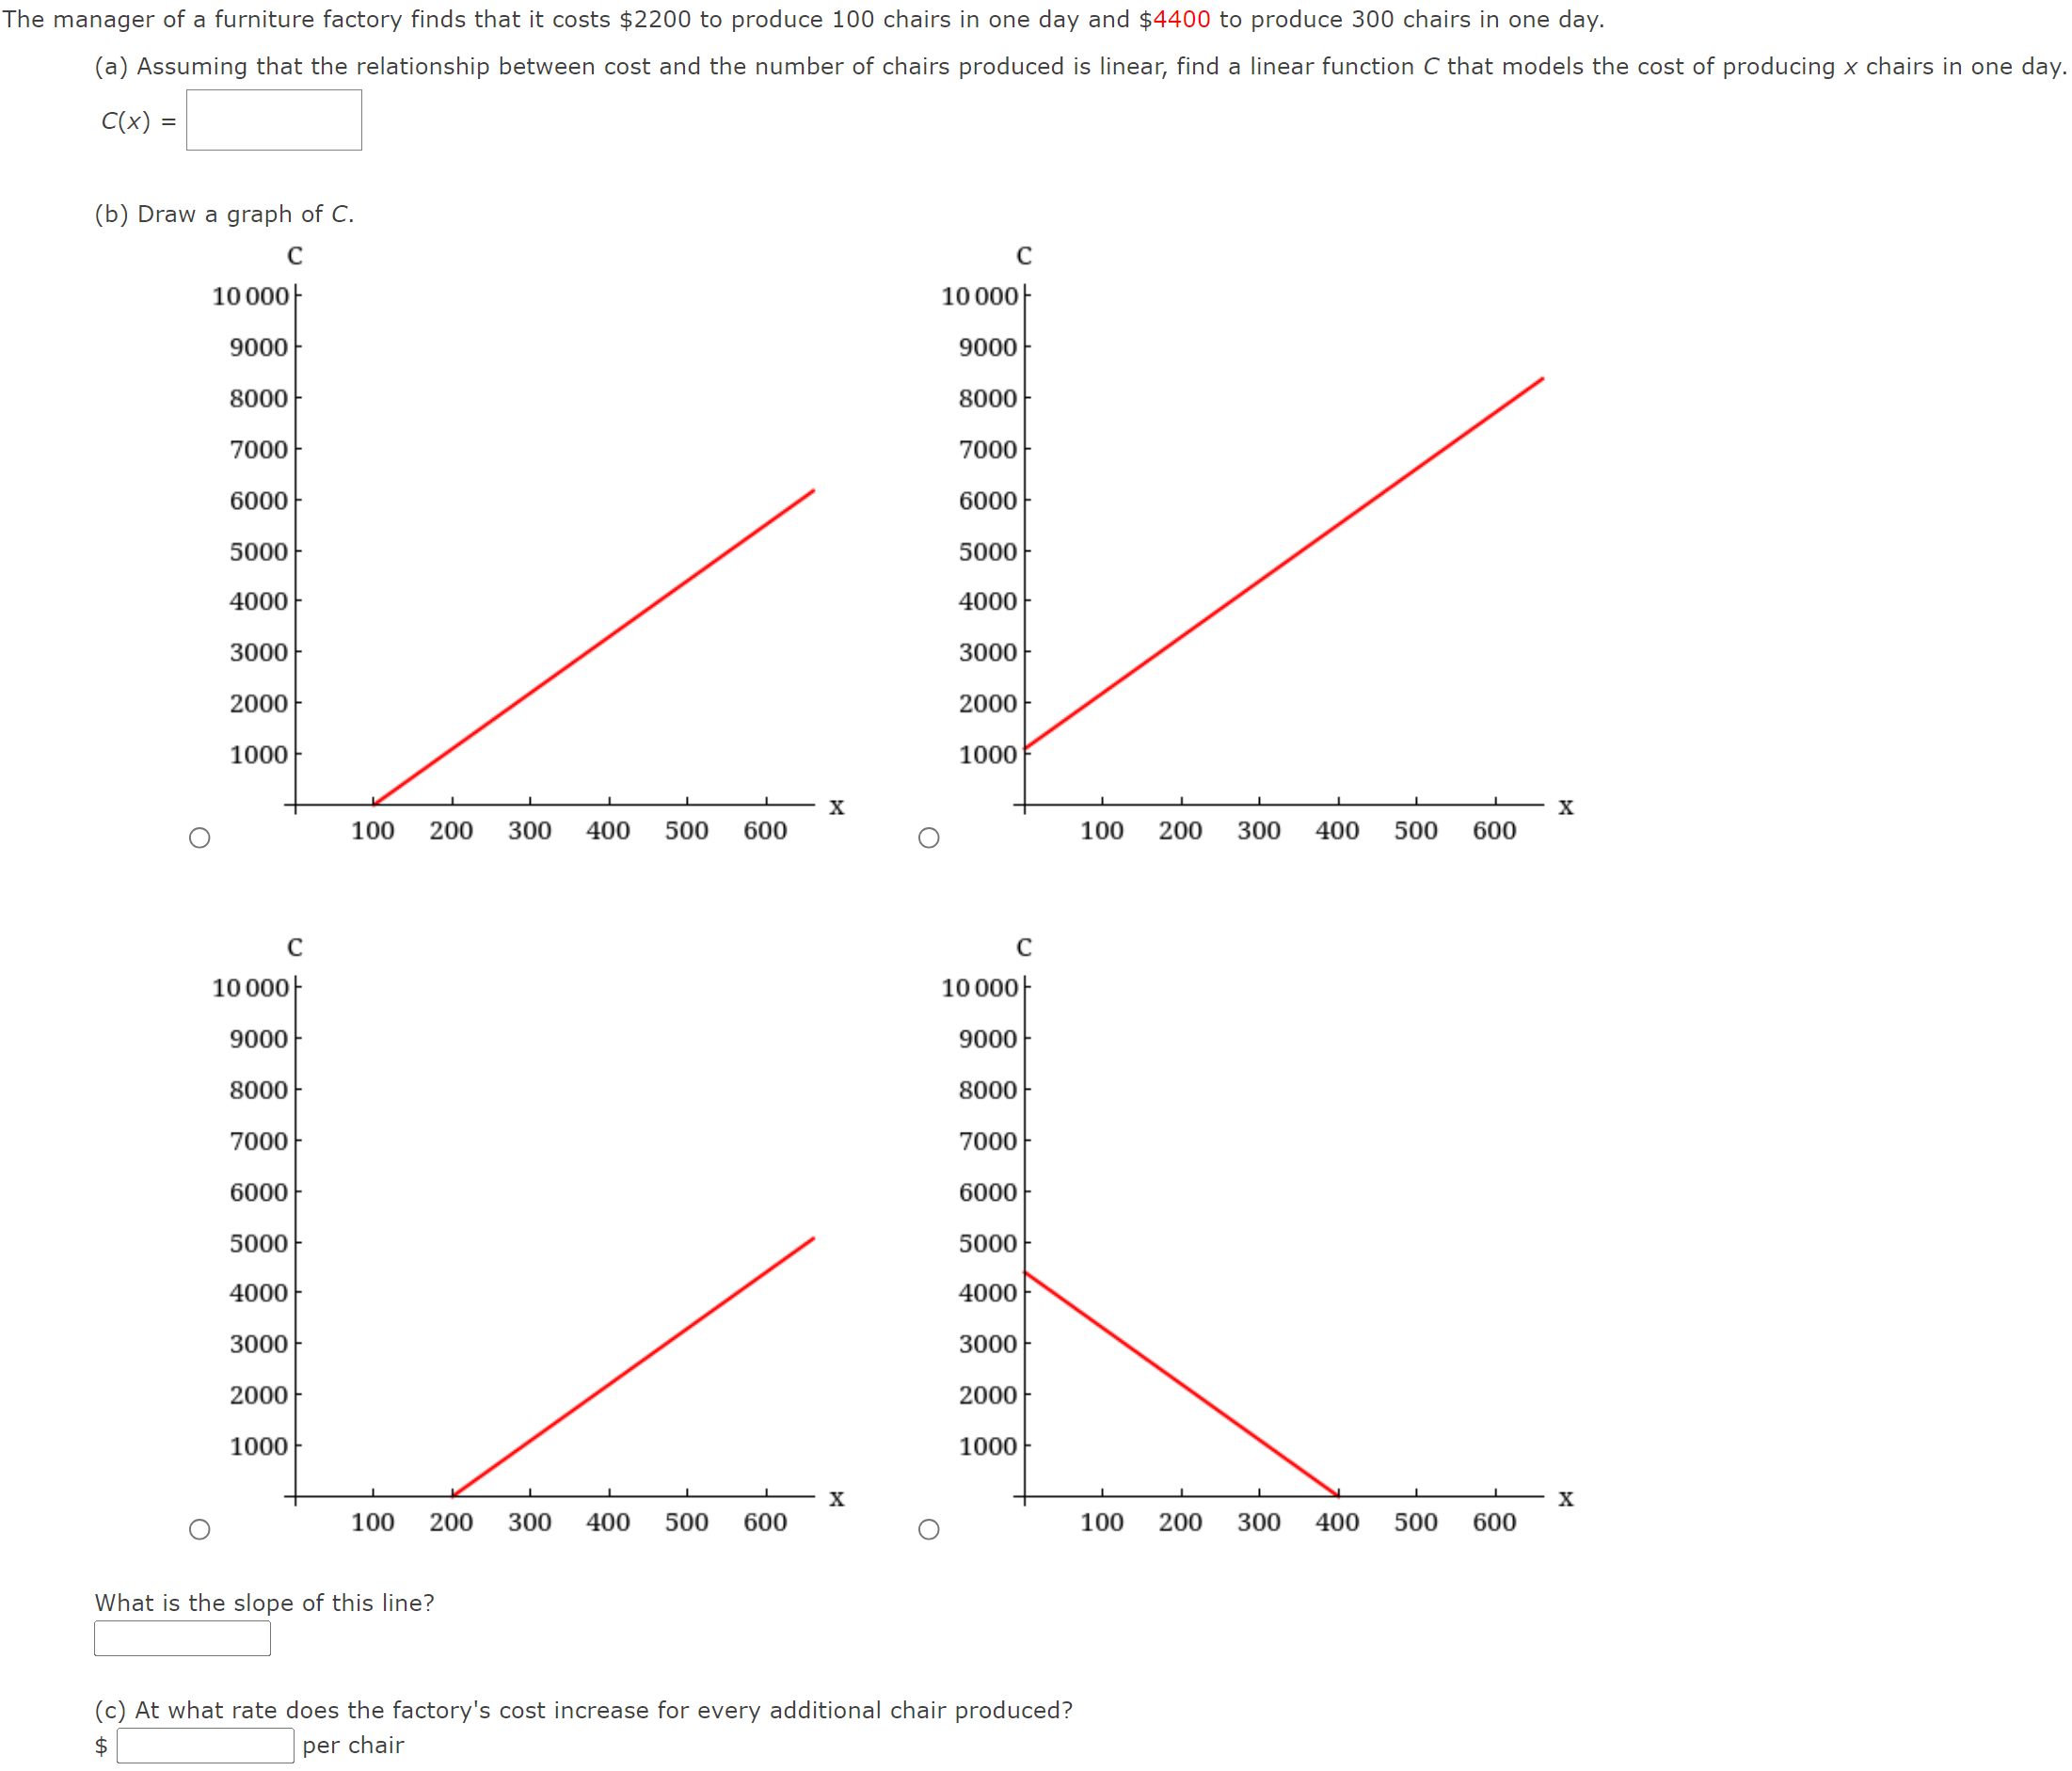
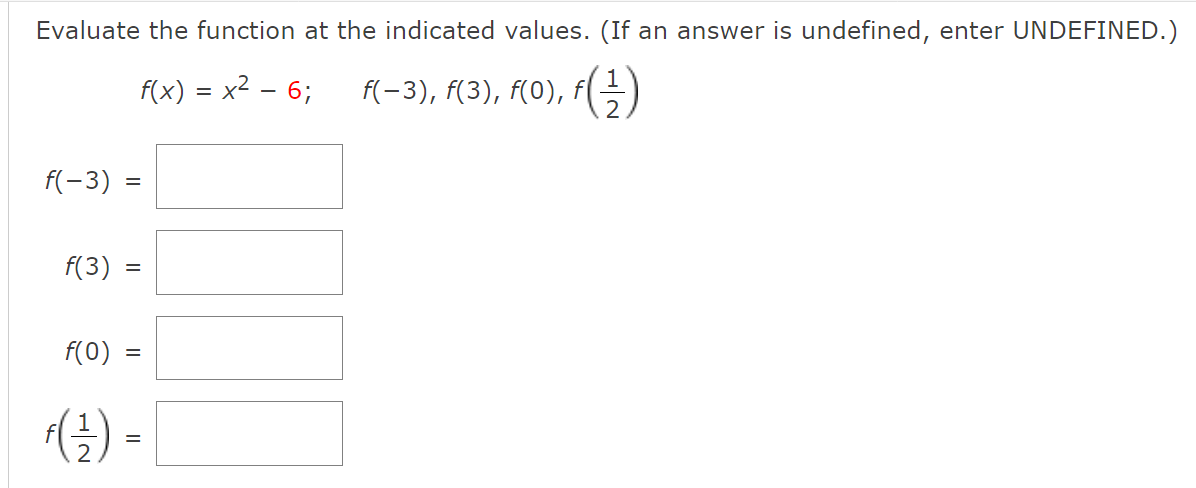
The graph of a function fis given. Use the graph to estimate the following. (Enter your answers using interval notation.) (a) The domain and range of f. o range (b) The intervals on which fis increasing and on which f is decreasing. decreasing The manager of a furniture factory finds that it costs $2200 to produce 100 chairs in one day and $4400 to produce 300 chairs in one day. (a) Assuming that the relationship between cost and the number of chairs produced is linear, find a linear function C that models the cost of producing x chairs in one day. C(x) = (b) Draw a graph of C. C 10000} 9000 8000 7000 6000 5000 4000 30001 2000 1000 X + Y L x 0 100 200 300 400 500 600 0 100 200 300 400 500 600 C C 10000} 10000} 9000 9000 8000 8000 7000 7000 6000 6000 5000 5000 4000} 4000 30001 30001 20001 20001 1000 1000+ X 0O 100 200 300 400 500 600 0 100 200 300 400 500 600 What is the slope of this line? (c) At what rate does the factory's cost increase for every additional chair produced? Evaluate the function at the indicated values. (If an answer is undefined, enter UNDEFINED.) f) =x2 -6, f(=3), A3), 7(0), (L) f(-3) = f(3) = f(0) =
Step by Step Solution
There are 3 Steps involved in it

Get step-by-step solutions from verified subject matter experts