

Question: The graph of a function f(t) is given below. 20 8.1 8.2 8:3 8:4 (Click on the graph for a larger version.) Which of the

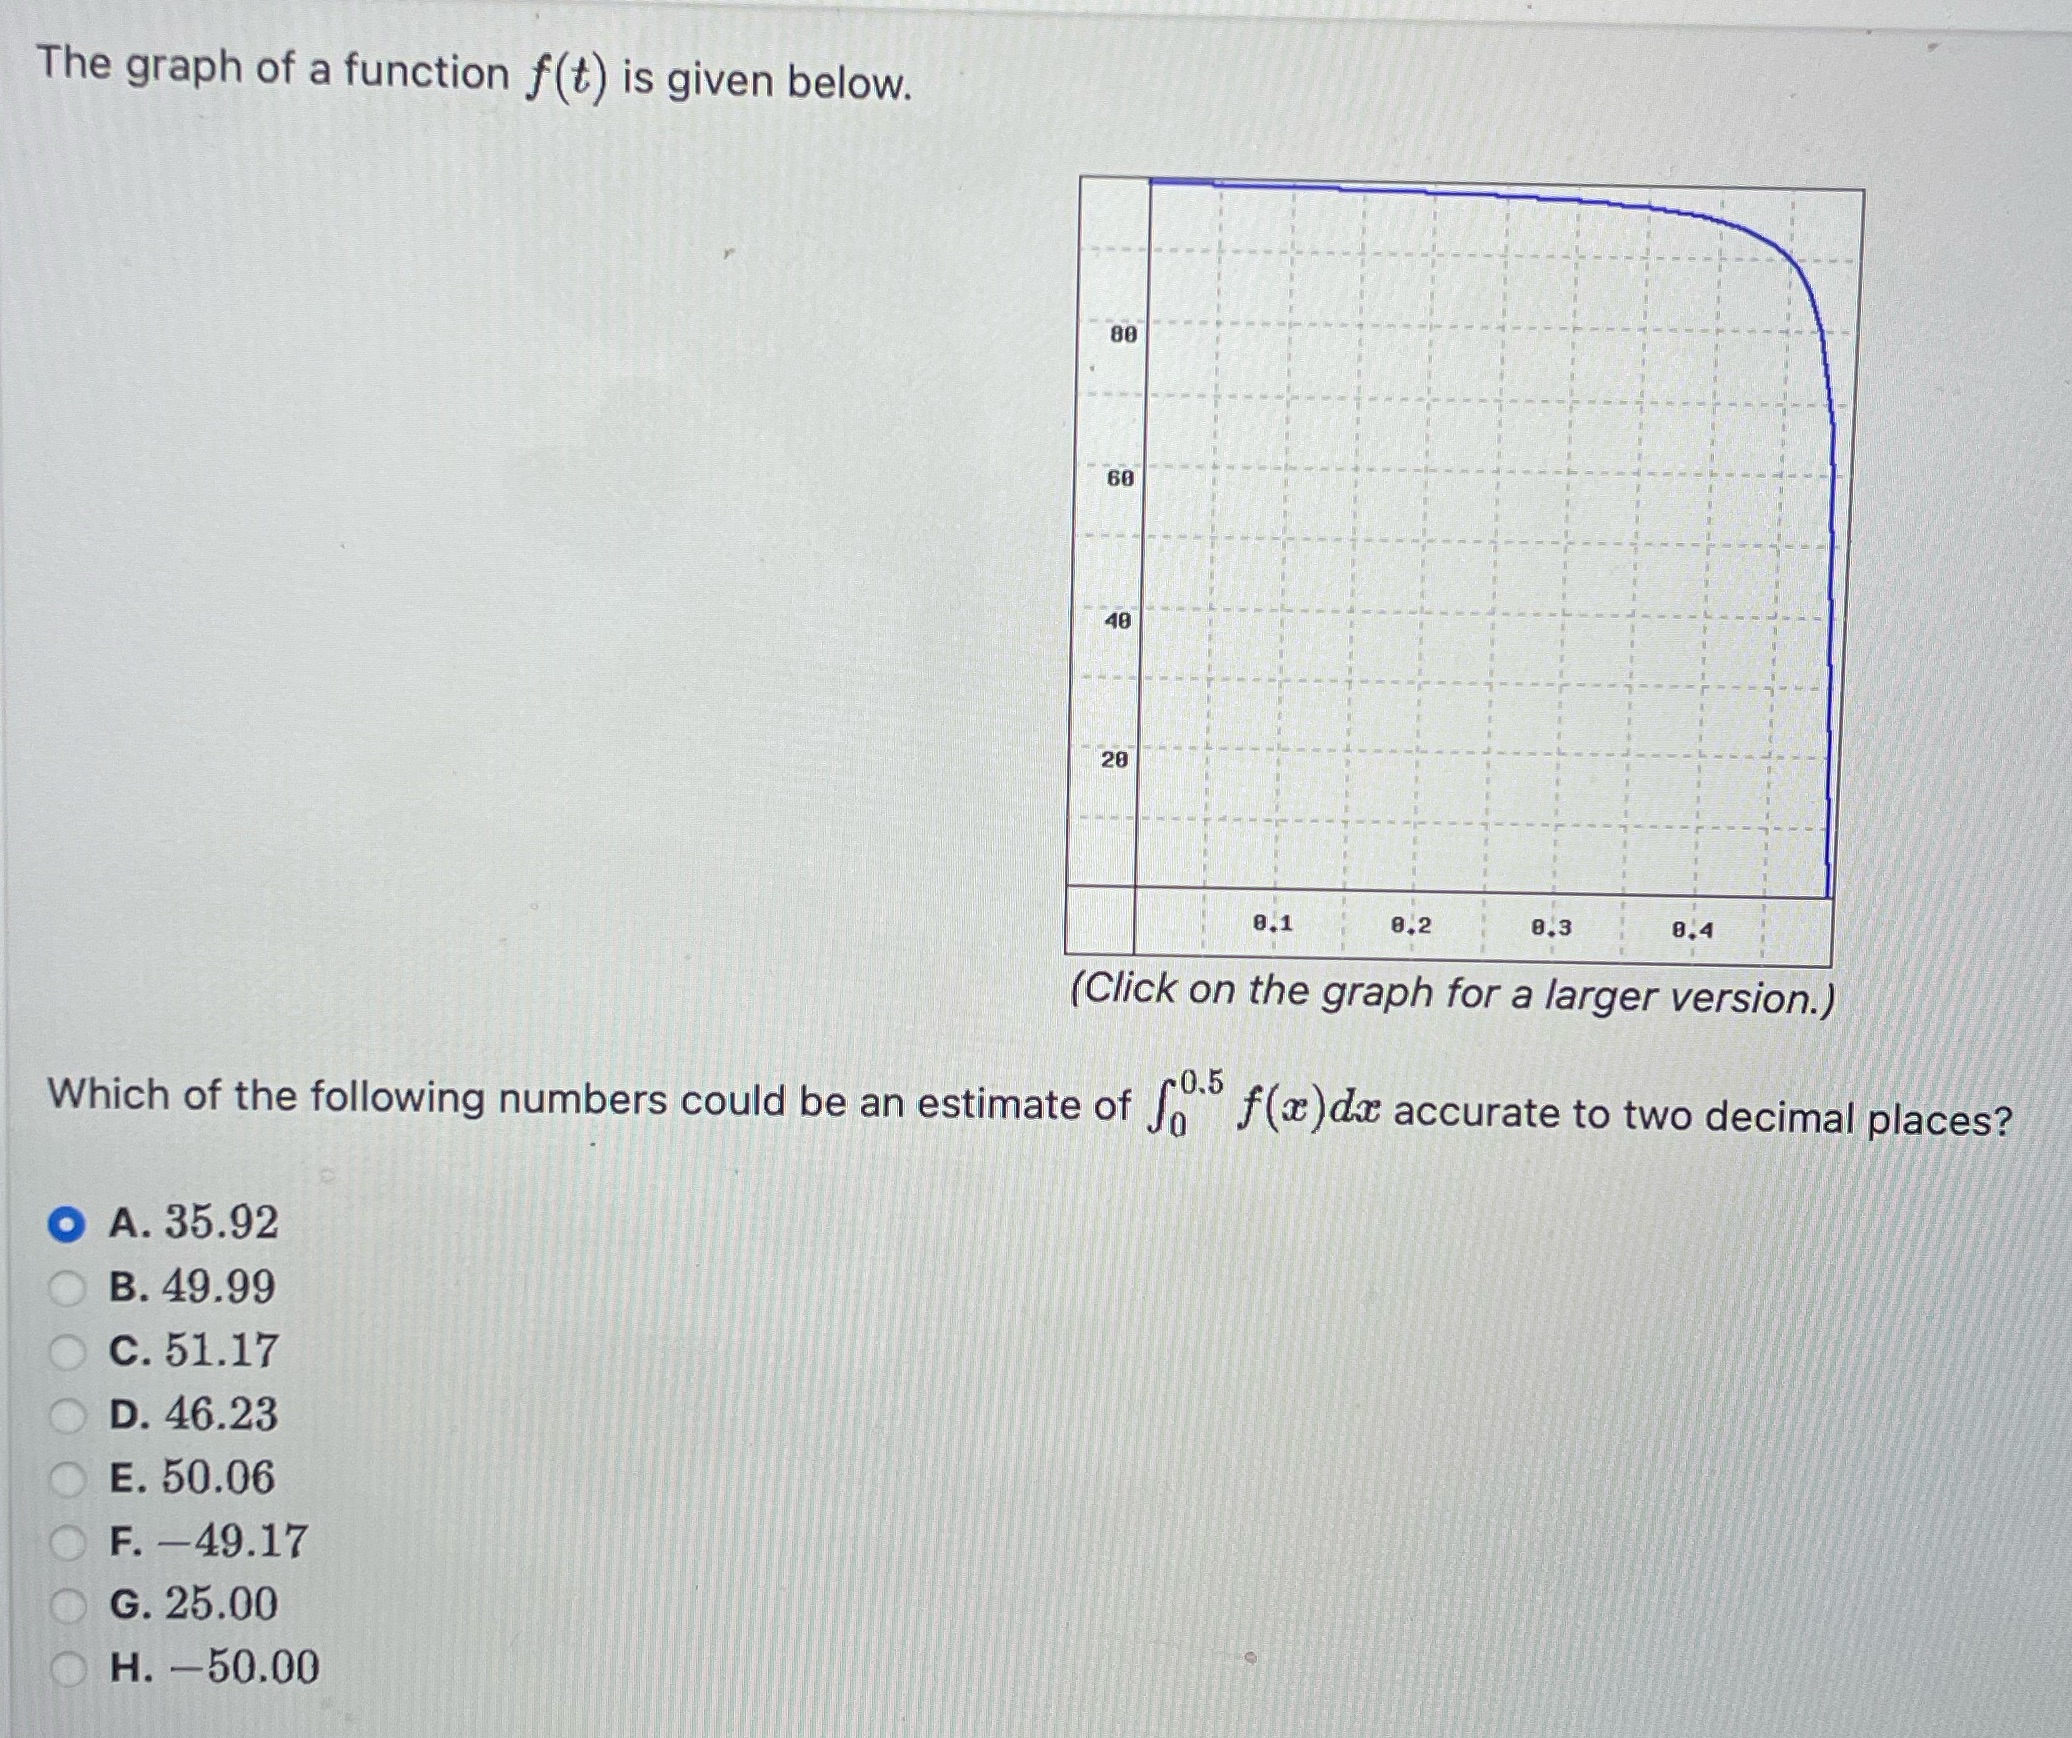
The graph of a function f(t) is given below. 20 8.1 8.2 8:3 8:4 (Click on the graph for a larger version.) Which of the following numbers could be an estimate of So" f(x) dx accurate to two decimal places? O A. 35.92 O B. 49.99 O C. 51.17 O D. 46.23 E. 50.06 OF. -49.17 OG. 25.00 OH. -50.00
Step by Step Solution
There are 3 Steps involved in it
1 Expert Approved Answer
Step: 1 Unlock

Question Has Been Solved by an Expert!
Get step-by-step solutions from verified subject matter experts
Step: 2 Unlock
Step: 3 Unlock