

Question: The graph of a function is given. Determine the average rate of change of the function between the indicated values of the variable (in red].
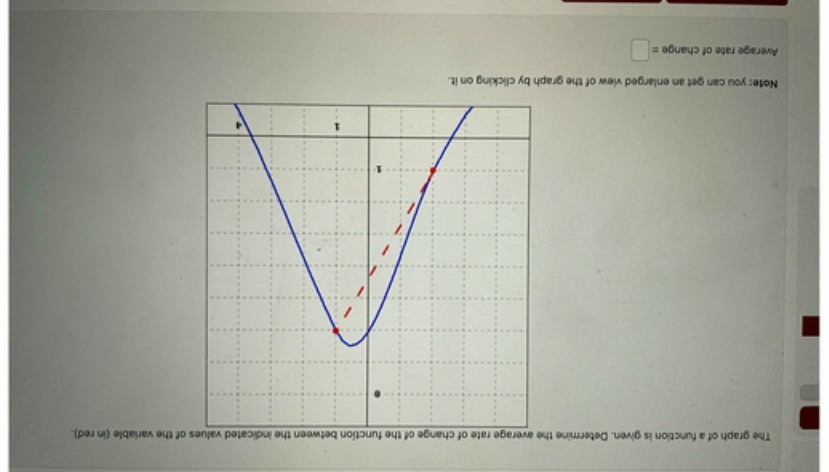
The graph of a function is given. Determine the average rate of change of the function between the indicated values of the variable (in red]. Note: you can get an enlarged view of the graph by clicking on it. Average rate of change =
Step by Step Solution
There are 3 Steps involved in it
1 Expert Approved Answer
Step: 1 Unlock

Question Has Been Solved by an Expert!
Get step-by-step solutions from verified subject matter experts
Step: 2 Unlock
Step: 3 Unlock