

Question: The graph of a function is given. y 6 2 WebAssign Plot X (a) Determine the net change between the indicated points on the graph.
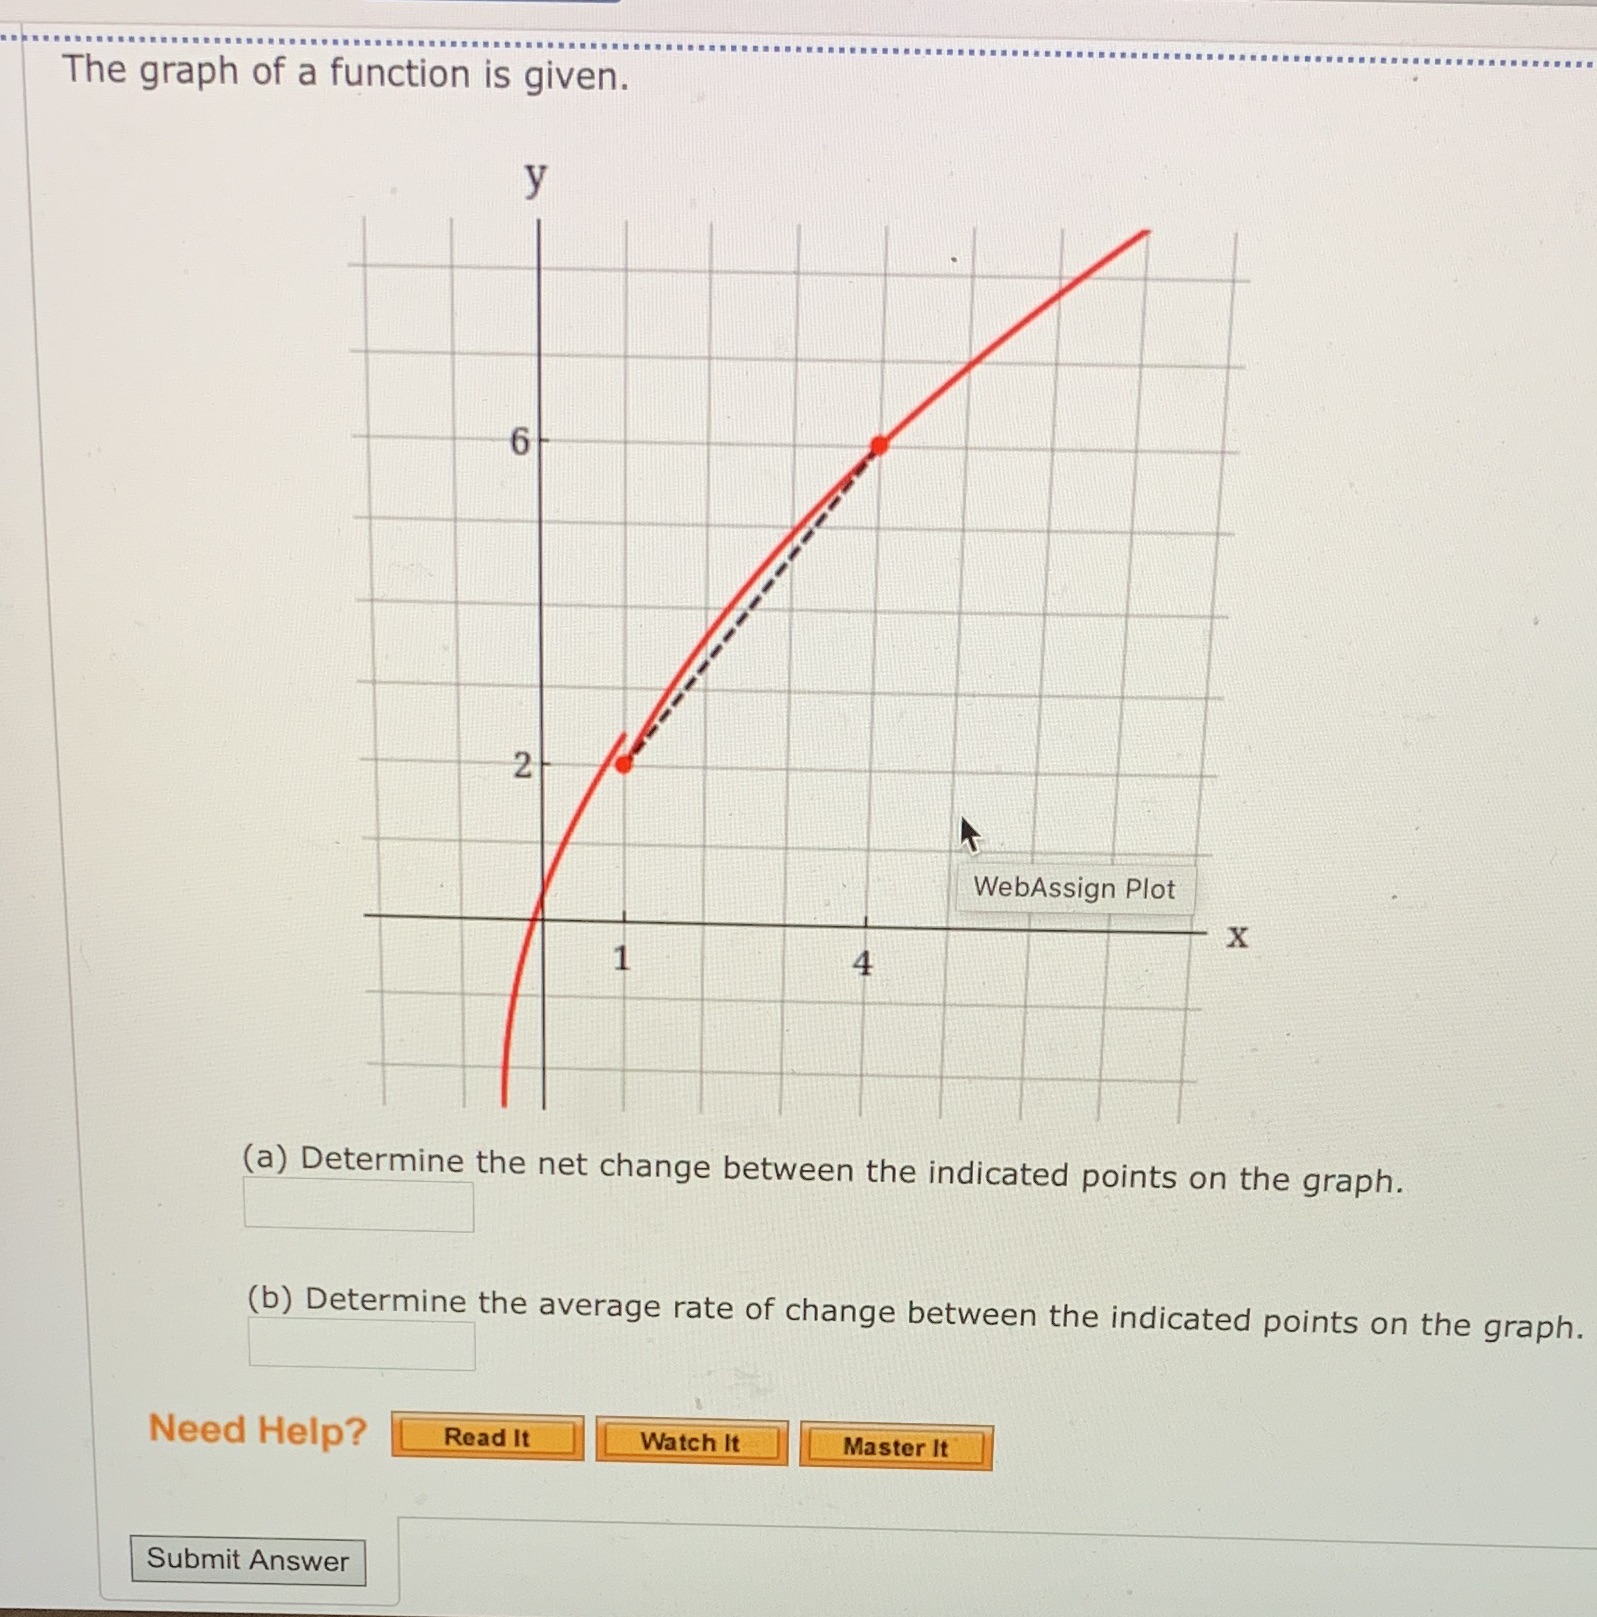
The graph of a function is given. y 6 2 WebAssign Plot X (a) Determine the net change between the indicated points on the graph. (b) Determine the average rate of change between the indicated points on the graph. Need Help? Read It Watch It Master It Submit
Step by Step Solution
There are 3 Steps involved in it
1 Expert Approved Answer
Step: 1 Unlock

Question Has Been Solved by an Expert!
Get step-by-step solutions from verified subject matter experts
Step: 2 Unlock
Step: 3 Unlock