

Question: The graph of a sine function with a positive coefficient is shown in the figure. y 8 - TT X JT/2 JT -8 (a) Find

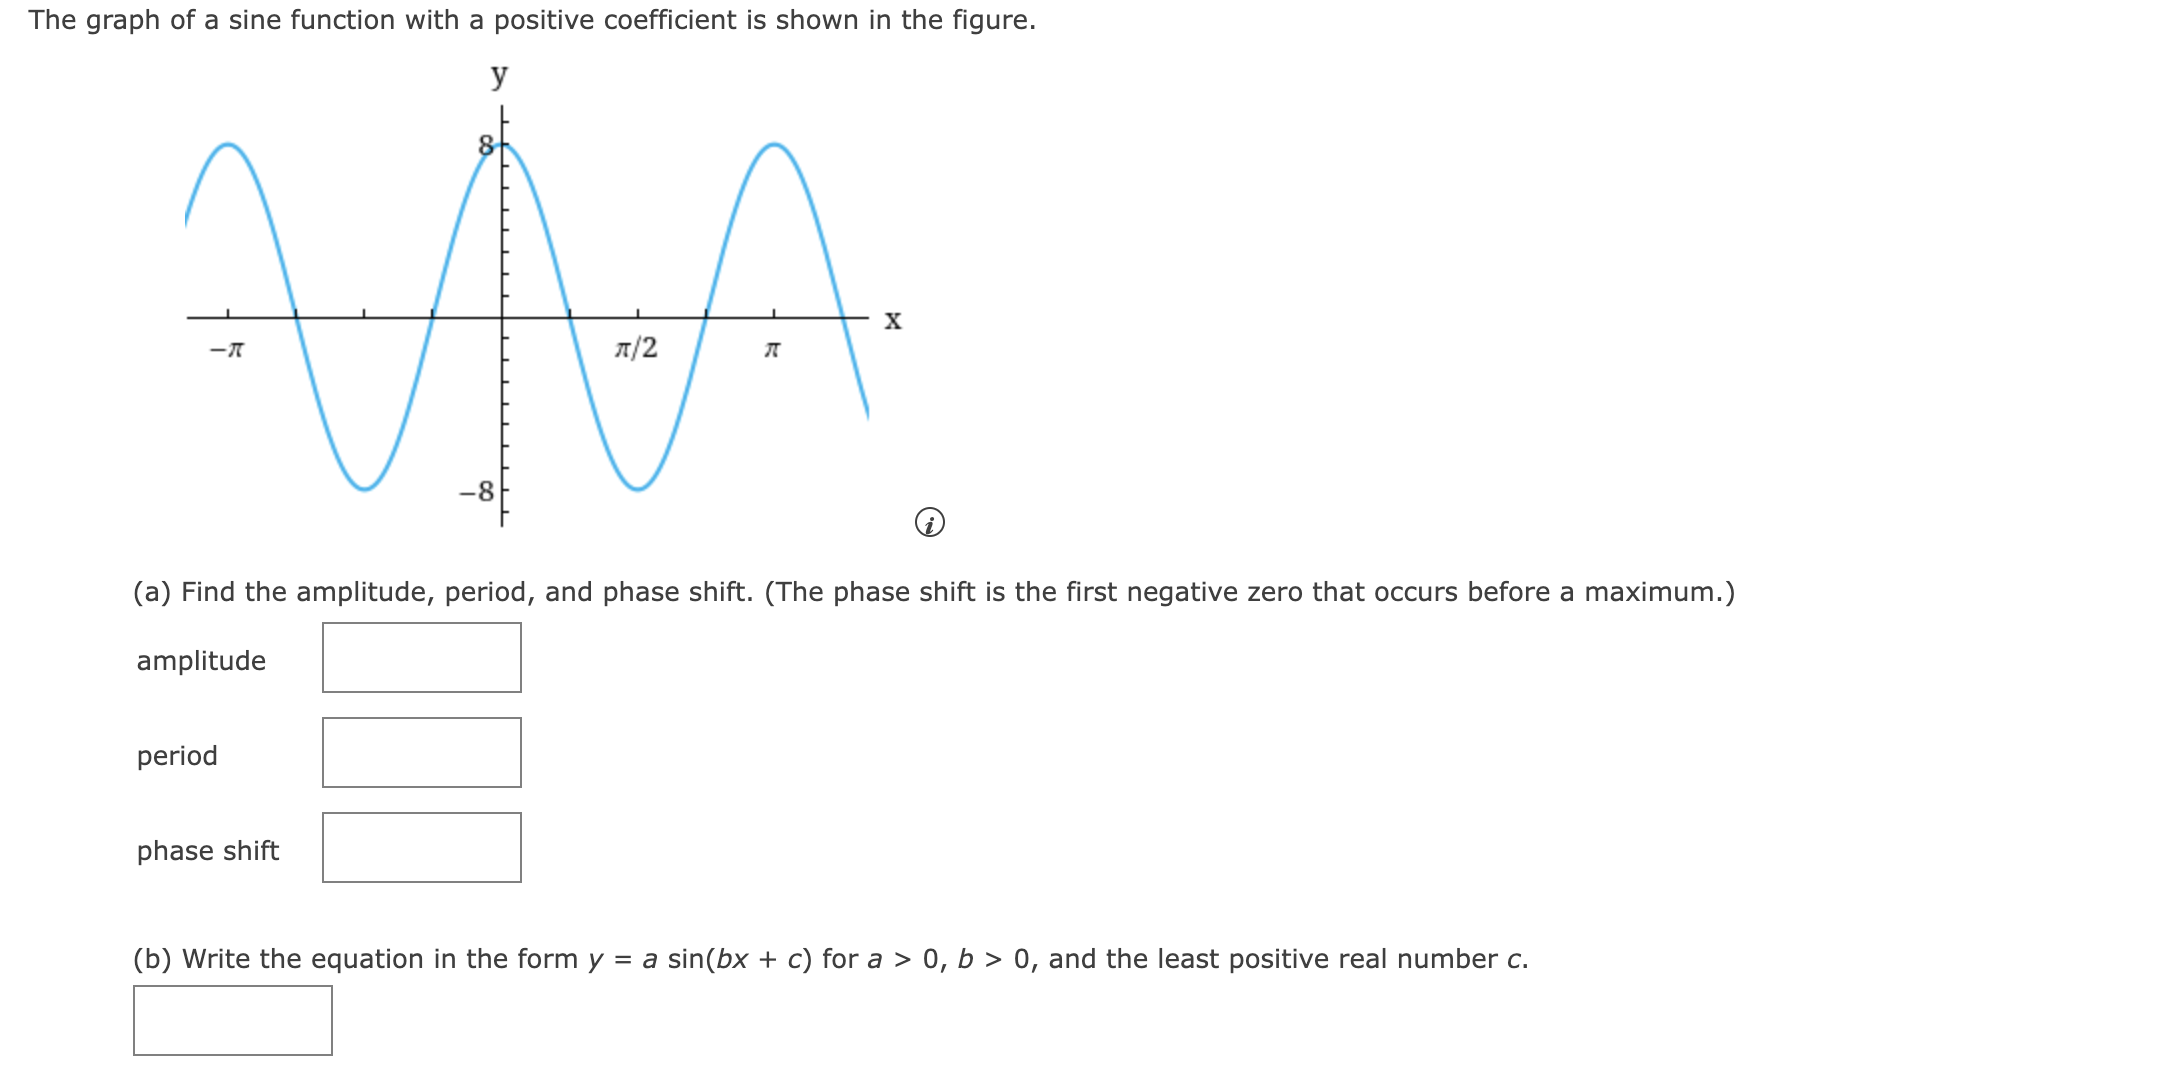
The graph of a sine function with a positive coefficient is shown in the figure. y 8 - TT X JT/2 JT -8 (a) Find the amplitude, period, and phase shift. (The phase shift is the first negative zero that occurs before a maximum.) amplitude period phase shift (b) Write the equation in the form y = a sin(bx + c) for a > 0, b > 0, and the least positive real number c
Step by Step Solution
There are 3 Steps involved in it
1 Expert Approved Answer
Step: 1 Unlock

Question Has Been Solved by an Expert!
Get step-by-step solutions from verified subject matter experts
Step: 2 Unlock
Step: 3 Unlock