

Question: The graph of the function f is shown. 4 2 -2 -8 2 A -4 -2 -10 -B lim f(x) =2? For what values of

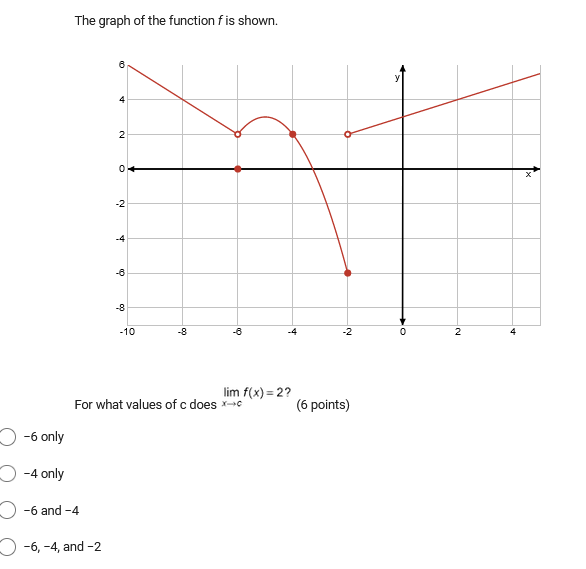
The graph of the function f is shown. 4 2 -2 -8 2 A -4 -2 -10 -B lim f(x) =2? For what values of c does x-+0 (6 points) -6 only -4 only O -6 and -4 -6, -4, and -2
Step by Step Solution
There are 3 Steps involved in it
1 Expert Approved Answer
Step: 1 Unlock

Question Has Been Solved by an Expert!
Get step-by-step solutions from verified subject matter experts
Step: 2 Unlock
Step: 3 Unlock