

Question: The graph of the function has one relative maximum and one relative minimum point. Plot these two points and check the concavity there. Using only
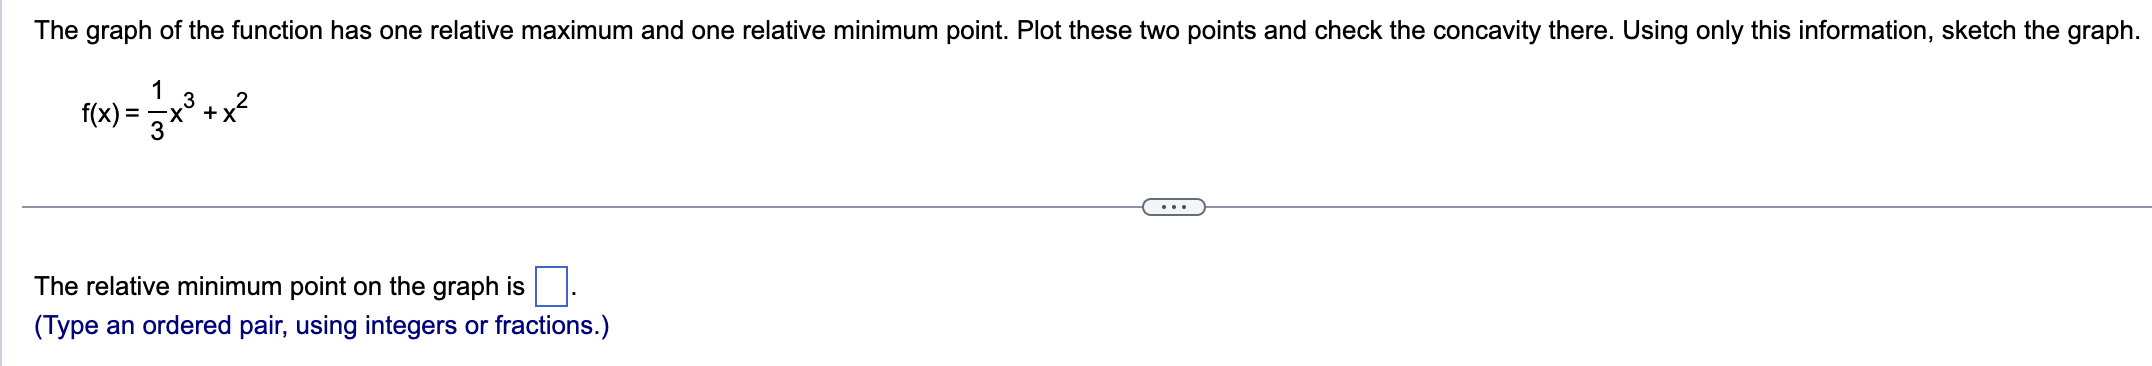

The graph of the function has one relative maximum and one relative minimum point. Plot these two points and check the concavity there. Using only this information, sketch the graph. 1 f(x) = 3x3 + x2 The relative minimum point on the graph is :|. (Type an ordered pair, using integers or fractions.)
Step by Step Solution
There are 3 Steps involved in it
1 Expert Approved Answer
Step: 1 Unlock

Question Has Been Solved by an Expert!
Get step-by-step solutions from verified subject matter experts
Step: 2 Unlock
Step: 3 Unlock