

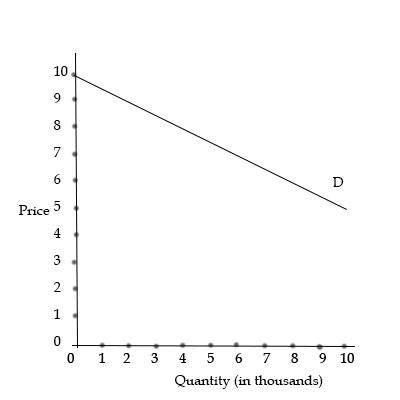
The graph below shows the market demand curve for a good. Use the graph to find total
Fantastic news! We've Found the answer you've been seeking!
Question:
The graph below shows the market demand curve for a good. Use the graph to find total revenue and marginal revenue at the given output levels. If the price is $8, then what is the total revenue is $ _____ thousands.
Expert Answer:

Related Book For 

Posted Date:
