

Question: The graph on the right shows the remaining life expectancy E in years for females of age x Find the average rate of change between

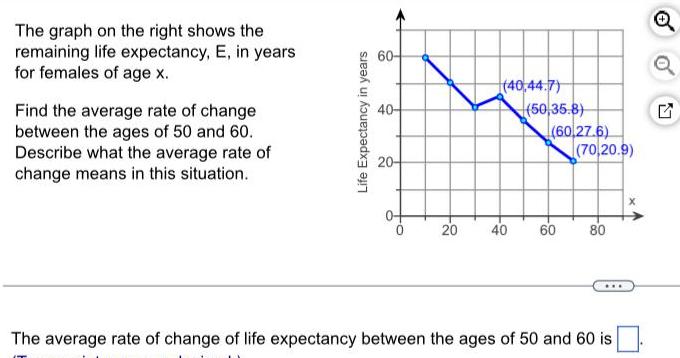
The graph on the right shows the remaining life expectancy E in years for females of age x Find the average rate of change between the ages of 50 and 60 Describe what the average rate of change means in this situation Life Expectancy in years 60 40 20 40 44 7 50 35 8 60 27 6 70 20 9 20 40 60 80 The average rate of change of life expectancy between the ages of 50 and 60 is O Q
Step by Step Solution
There are 3 Steps involved in it
1 Expert Approved Answer
Step: 1 Unlock

Question Has Been Solved by an Expert!
Get step-by-step solutions from verified subject matter experts
Step: 2 Unlock
Step: 3 Unlock