

Question: The graph represents a labor market. What is the equilibrium hourly wage? What is the equilibrium number of hours worked? per hour increase in
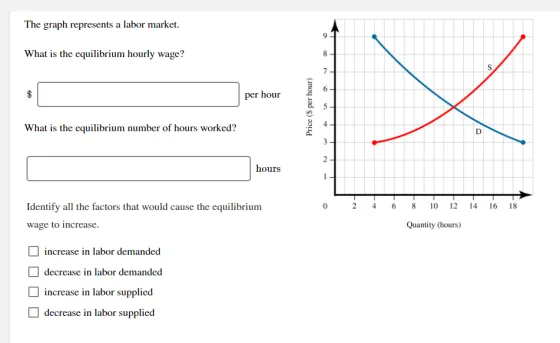
The graph represents a labor market. What is the equilibrium hourly wage? What is the equilibrium number of hours worked? per hour increase in labor demanded decrease in labor demanded increase in labor supplied decrease in labor supplied hours Identify all the factors that would cause the equilibrium wage to increase. Price (S per hour) 8 7 0 4 6 8 D 10 12 14 16 Quantity (hours) 18
Step by Step Solution
There are 3 Steps involved in it
1 Equilibrium hourly wage The equilibrium hourly wage is determined by the intersection of the labor supply and labor demand curves on the graph At th... View full answer

Get step-by-step solutions from verified subject matter experts