

Question: The graph represents the revenue a company generates when it sells x units of a product. How many units should the company sell to generate
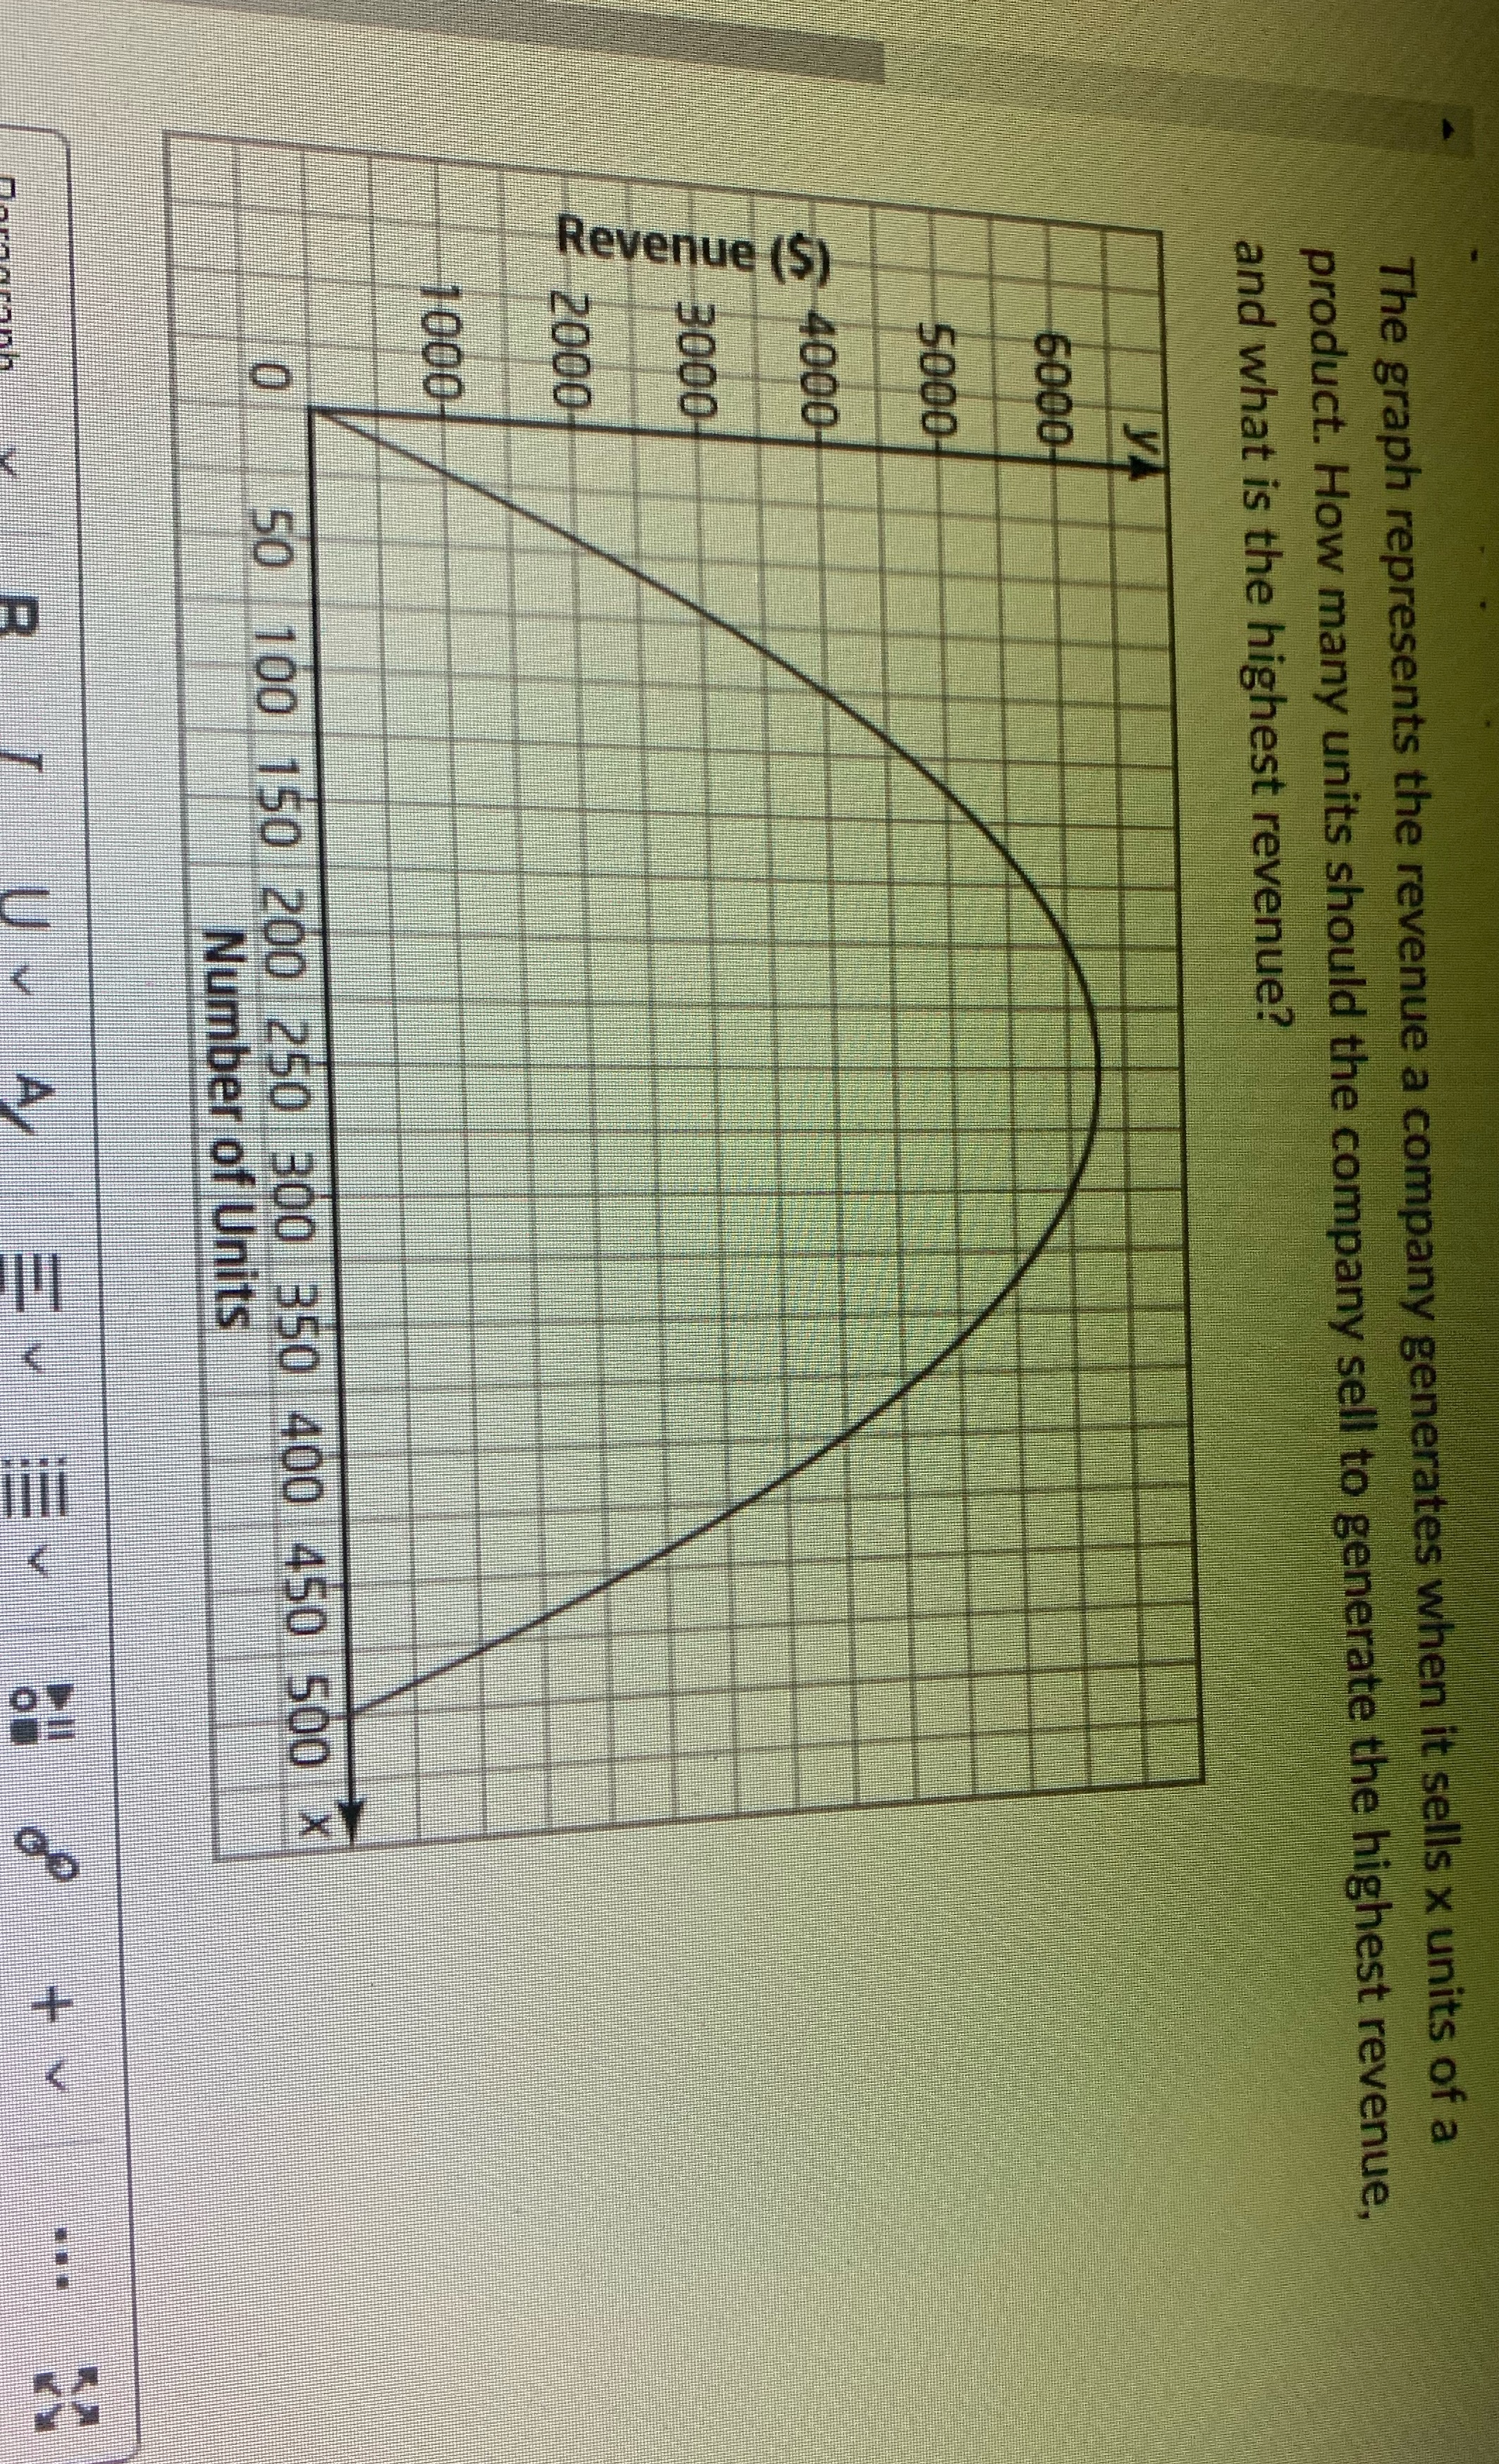
The graph represents the revenue a company generates when it sells x units of a product. How many units should the company sell to generate the highest revenue, and what is the highest revenue? 6000 5000- 4000- Revenue (S) 3000- 2000 1000 O 50 100 150 200 250 300 350 400 450 500 X Number of Units v A V
Step by Step Solution
There are 3 Steps involved in it
1 Expert Approved Answer
Step: 1 Unlock

Question Has Been Solved by an Expert!
Get step-by-step solutions from verified subject matter experts
Step: 2 Unlock
Step: 3 Unlock