

Question: The graph shown here: 0.30 0.45 0.40 0.35 + 0.30 (mol dm-3) concentration 0.25 0.20 0.15 0.10 00S 000 0 10 30 40 time (s)
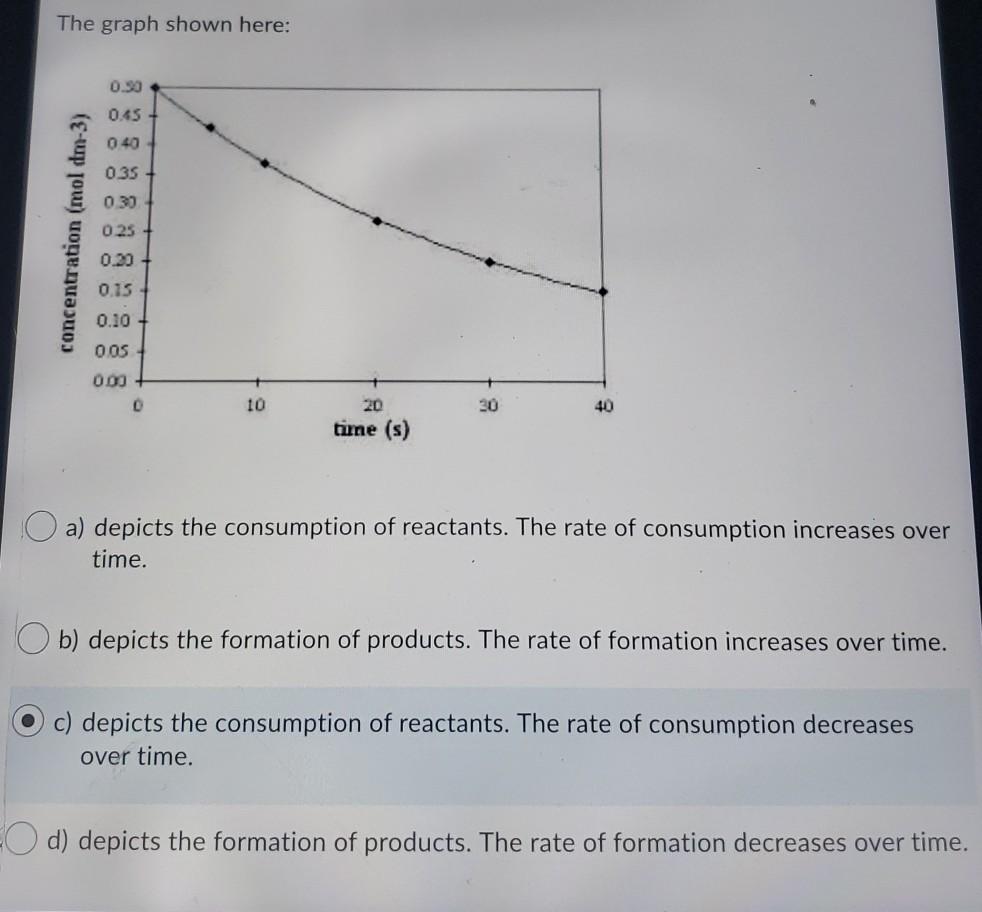
The graph shown here: 0.30 0.45 0.40 0.35 + 0.30 (mol dm-3) concentration 0.25 0.20 0.15 0.10 00S 000 0 10 30 40 time (s) O a) depicts the consumption of reactants. The rate of consumption increases over time. Ob) depicts the formation of products. The rate of formation increases over time. c) depicts the consumption of reactants. The rate of consumption decreases over time. O d) depicts the formation of products. The rate of formation decreases over time
Step by Step Solution
There are 3 Steps involved in it
1 Expert Approved Answer
Step: 1 Unlock

Question Has Been Solved by an Expert!
Get step-by-step solutions from verified subject matter experts
Step: 2 Unlock
Step: 3 Unlock