

Question: The graph shown represents the height, in 10 14 15 centimetres, of a pendulum, at time t seconds, as it swings. Finish attempt ... y
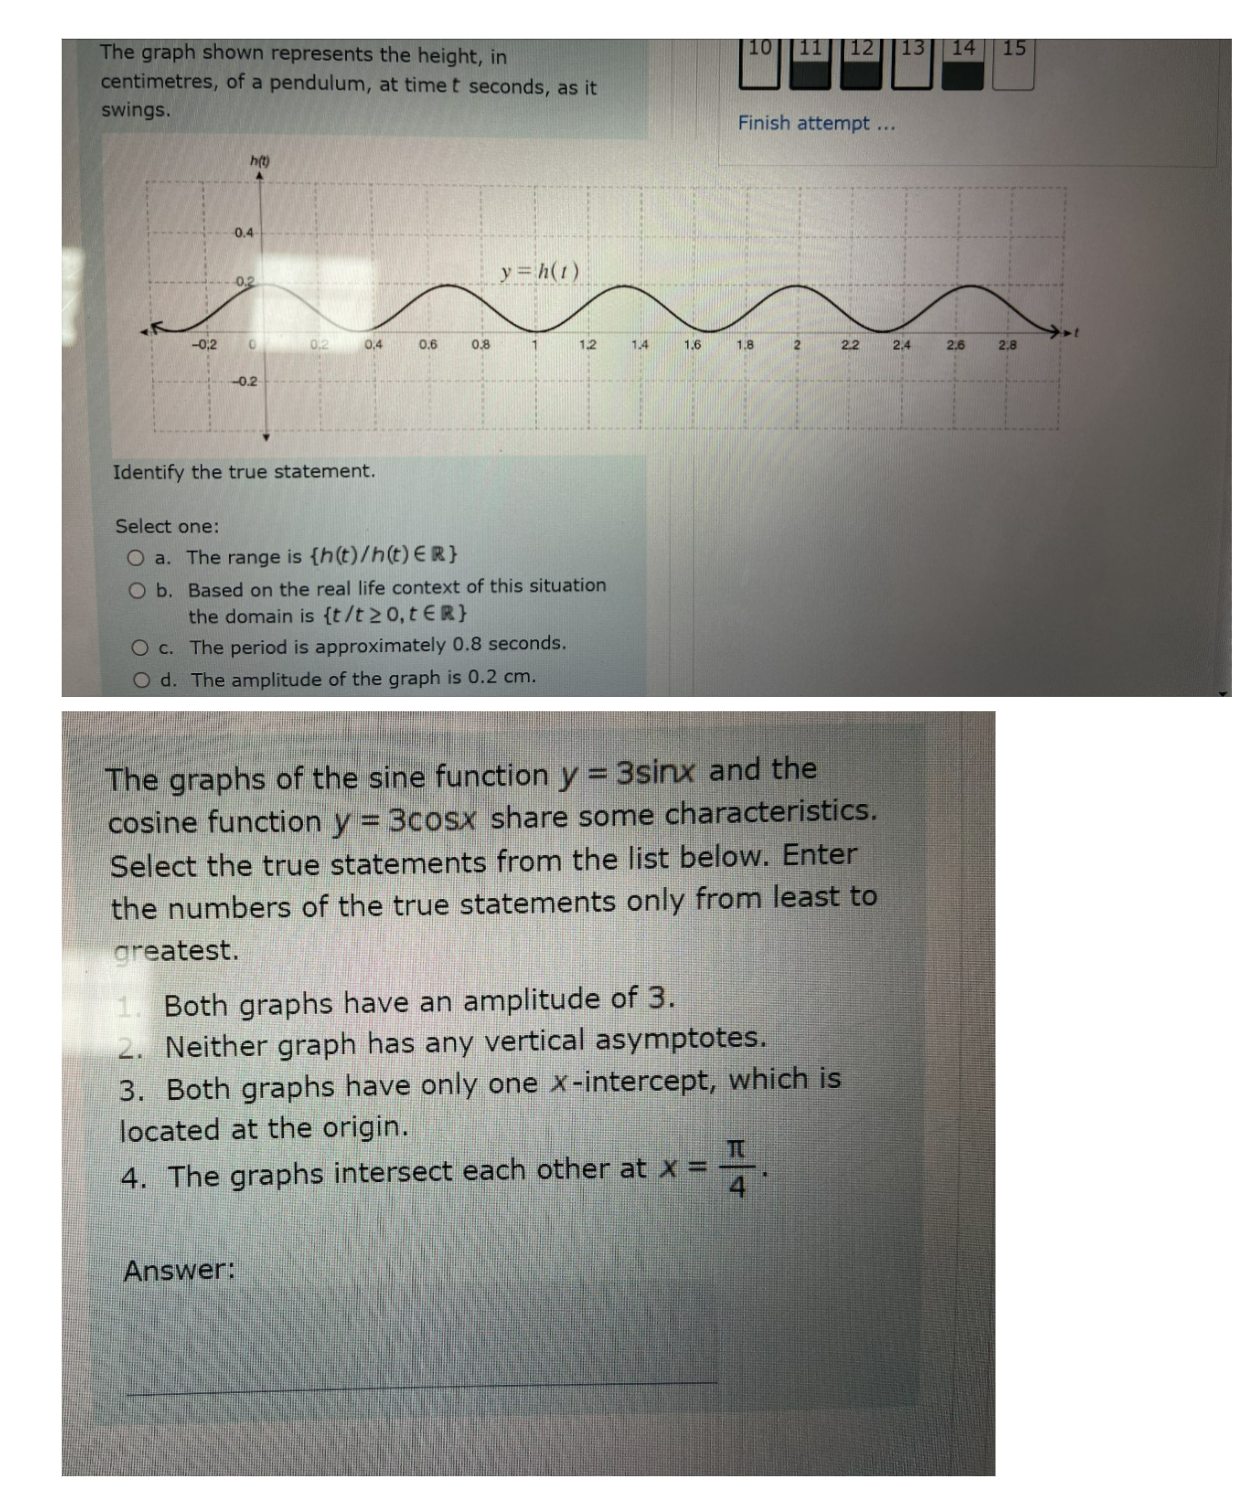

The graph shown represents the height, in 10 14 15 centimetres, of a pendulum, at time t seconds, as it swings. Finish attempt ... y = h(1) -0.2 0.4 0.6 0.8 1.2 1.4 1.6 1.8 2.2 2.4 2.6 2,8 -02 Identify the true statement. Select one: O a. The range is {h(t)/h(t) ER} O b. Based on the real life context of this situation the domain is {t/t 2 0, t ER} O c. The period is approximately 0.8 seconds. O d. The amplitude of the graph is 0.2 cm. The graphs of the sine function y = 3sinx and the cosine function y = 3cosx share some characteristics. Select the true statements from the list below. Enter the numbers of the true statements only from least to greatest. 1. Both graphs have an amplitude of 3. 2. Neither graph has any vertical asymptotes. 3. Both graphs have only one x-intercept, which is located at the origin. 4. The graphs intersect each other at x = - 4
Step by Step Solution
There are 3 Steps involved in it

Get step-by-step solutions from verified subject matter experts