

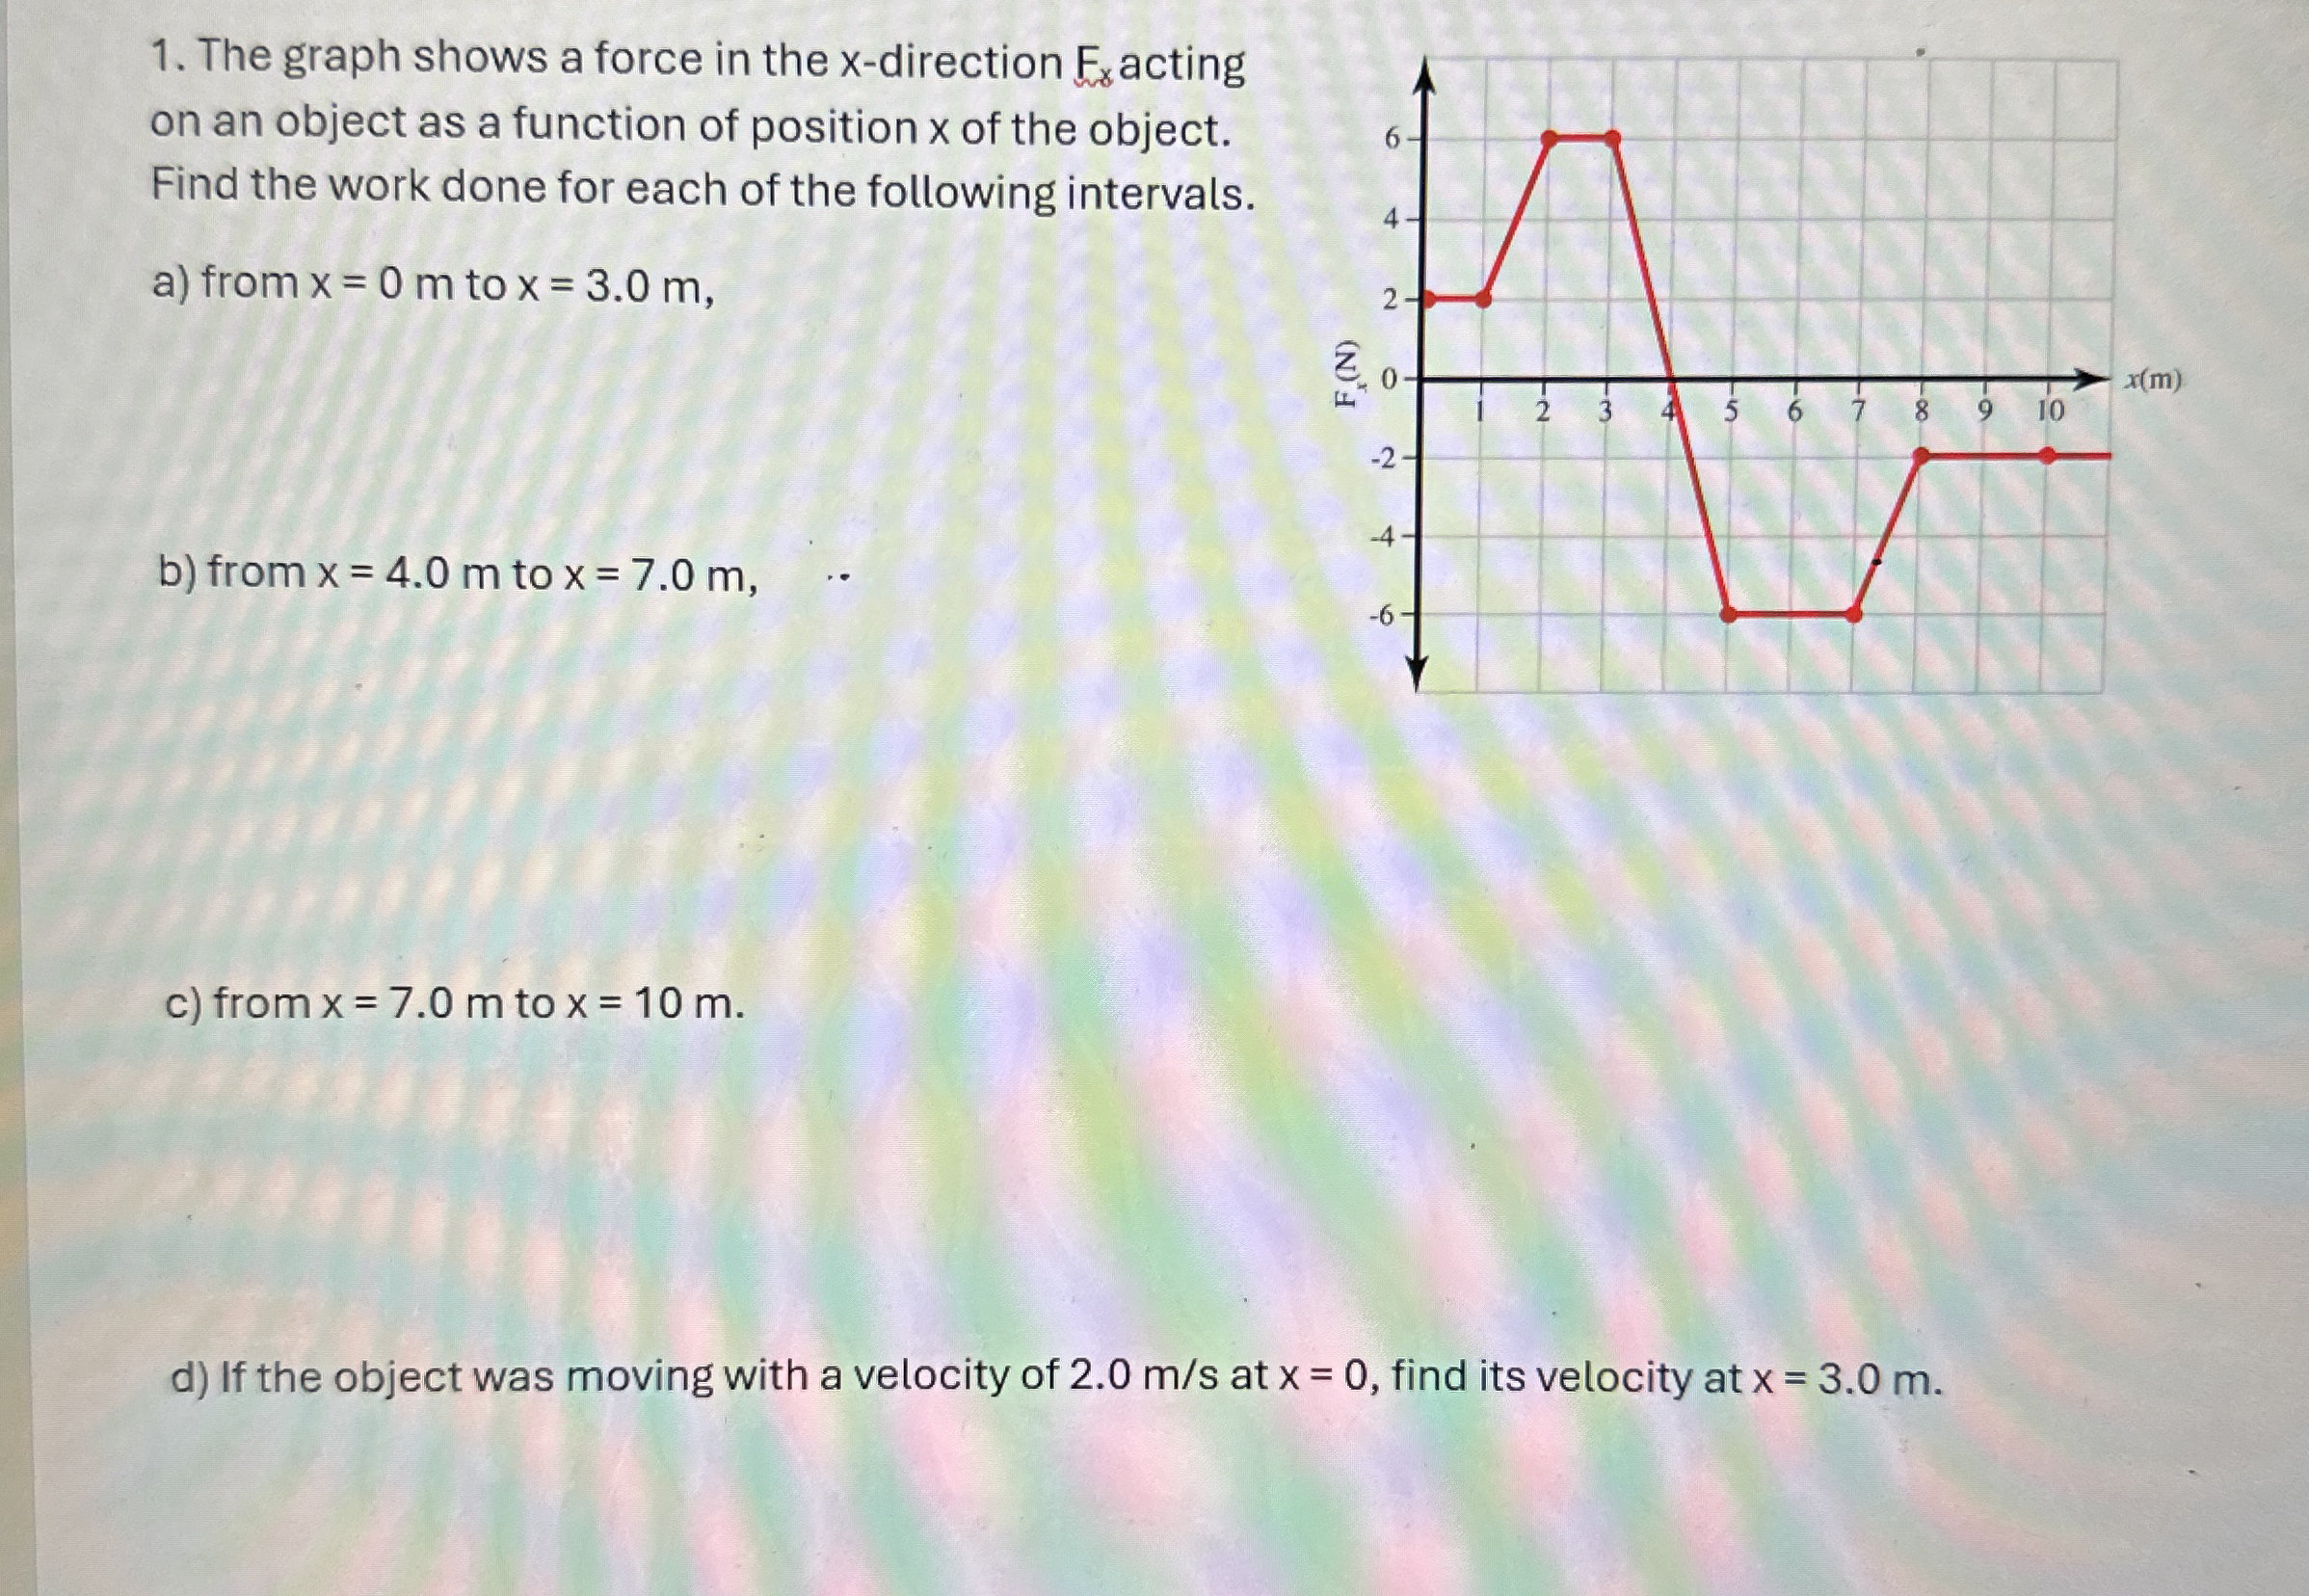
Question: The graph shows a force in the x - direction F x acting on an object as a function of position x of the object.
The graph shows a force in the x direction acting on an object as a function of position of the object. Find the work done for each of the following intervals.
a from to
b from to
c from to
d If the object was moving with a velocity of ms at find its velocity at
Step by Step Solution
There are 3 Steps involved in it
1 Expert Approved Answer
Step: 1 Unlock

Question Has Been Solved by an Expert!
Get step-by-step solutions from verified subject matter experts
Step: 2 Unlock
Step: 3 Unlock