

Question: The graph shows a normal curve for the random variable X, with mean u and standard deviation o. Answers/work may be entered in the essay
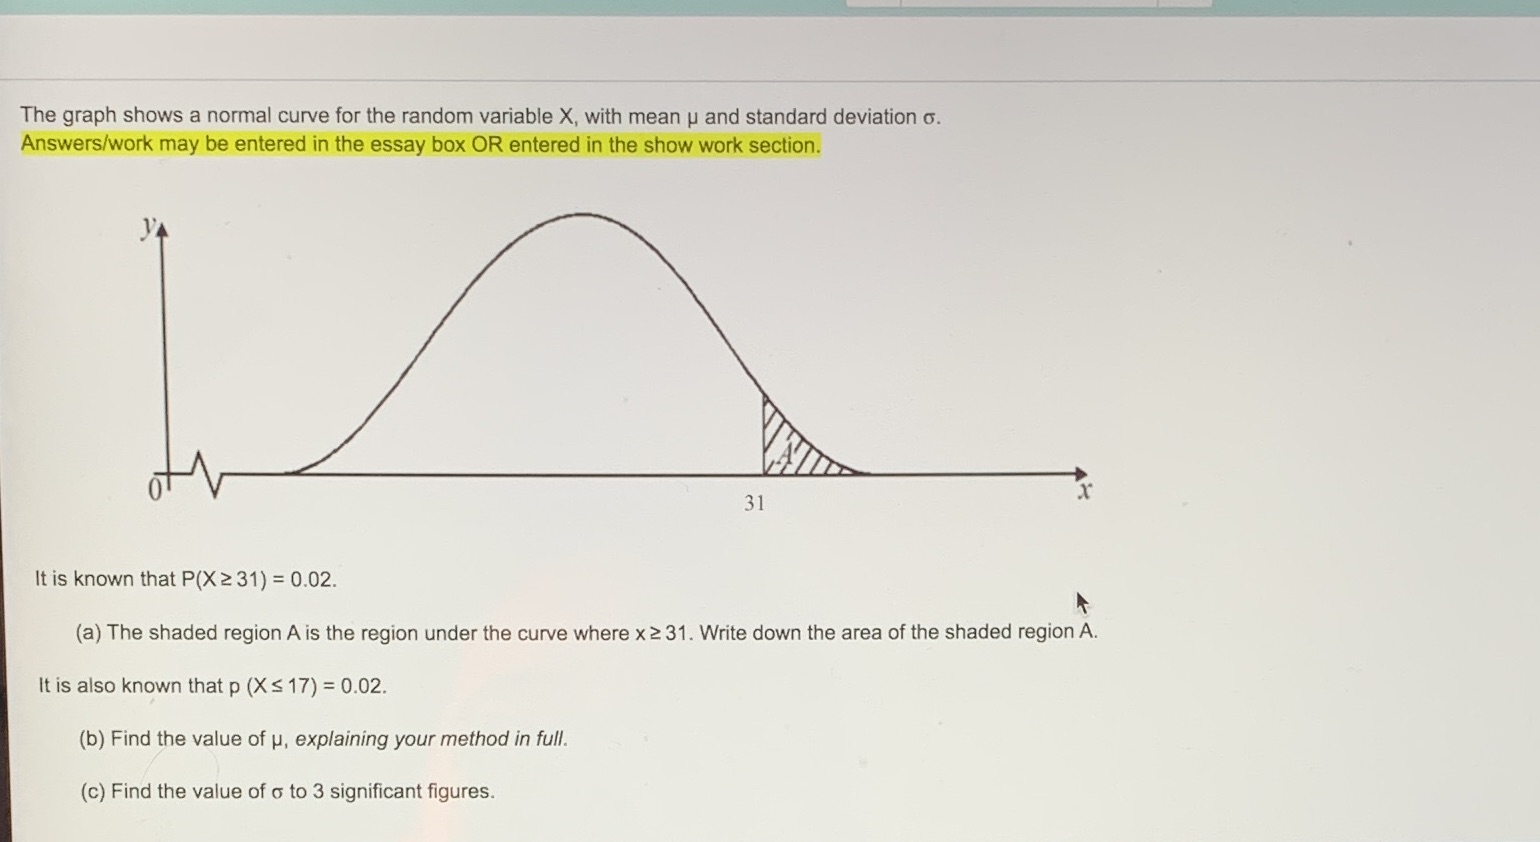
The graph shows a normal curve for the random variable X, with mean u and standard deviation o. Answers/work may be entered in the essay box OR entered in the show work section. 31 It is known that P(X 2 31) = 0.02. (a) The shaded region A is the region under the curve where x 2 31. Write down the area of the shaded region A. It is also known that p (X S 17) = 0.02. (b) Find the value of u, explaining your method in full. (c) Find the value of o to 3 significant figures
Step by Step Solution
There are 3 Steps involved in it
1 Expert Approved Answer
Step: 1 Unlock

Question Has Been Solved by an Expert!
Get step-by-step solutions from verified subject matter experts
Step: 2 Unlock
Step: 3 Unlock