

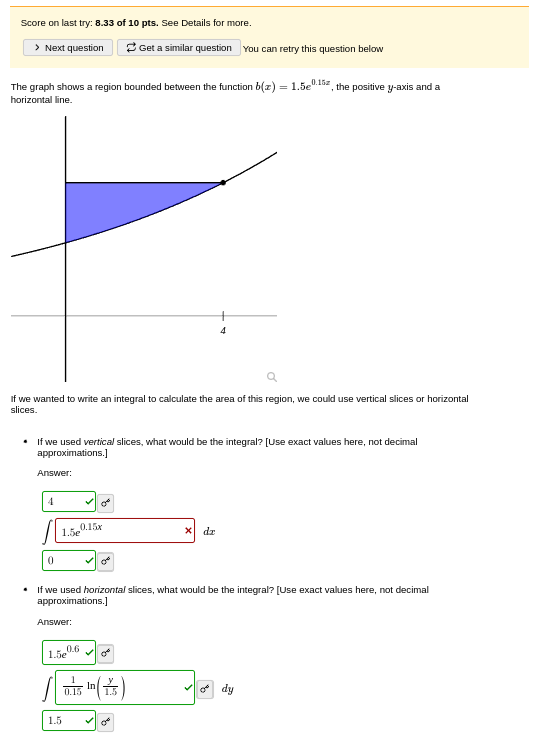
Question: The graph shows a region bounded between the function b ( x ) = 1 . 5 e ^ ( 0 . 1 5 x
The graph shows a region bounded between the function bxex the positive yaxis and a horizontal line.
A note from my teacher is to try drawing the vertical slices in and considering the height carefully.
Step by Step Solution
There are 3 Steps involved in it
1 Expert Approved Answer
Step: 1 Unlock

Question Has Been Solved by an Expert!
Get step-by-step solutions from verified subject matter experts
Step: 2 Unlock
Step: 3 Unlock