

Question: The graph shows the aggregate demand curve in a representative economy. Suppose that this economy is known to be operating below full employment.?? ?1.) Using
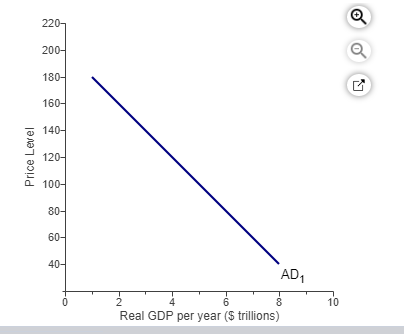
The graph shows the aggregate demand curve in a representative economy.
Suppose that this economy is known to be operating below full employment.??
?1.) Using the line drawing tool?, draw the Keynesian?short-run aggregate supply curve. Properly label your line.
?2.) Using the point drawing tool?, show the equilibrium price and quantity. Label the point ?'E1?'.
Carefully follow the instructions?above, and only draw the required objects.

220- 200- 180- 160- 140- Price Level 120- 100- 80- 60- 40- AD1 6 8 10 Real GDP per year ($ trillions)
Step by Step Solution
There are 3 Steps involved in it
1 Expert Approved Answer
Step: 1 Unlock

Question Has Been Solved by an Expert!
Get step-by-step solutions from verified subject matter experts
Step: 2 Unlock
Step: 3 Unlock