

Question: The graph shows the average cost for a dozen eggs over a 10-year period. Use the graph to answer the question. cost 2 (0, 1.5)
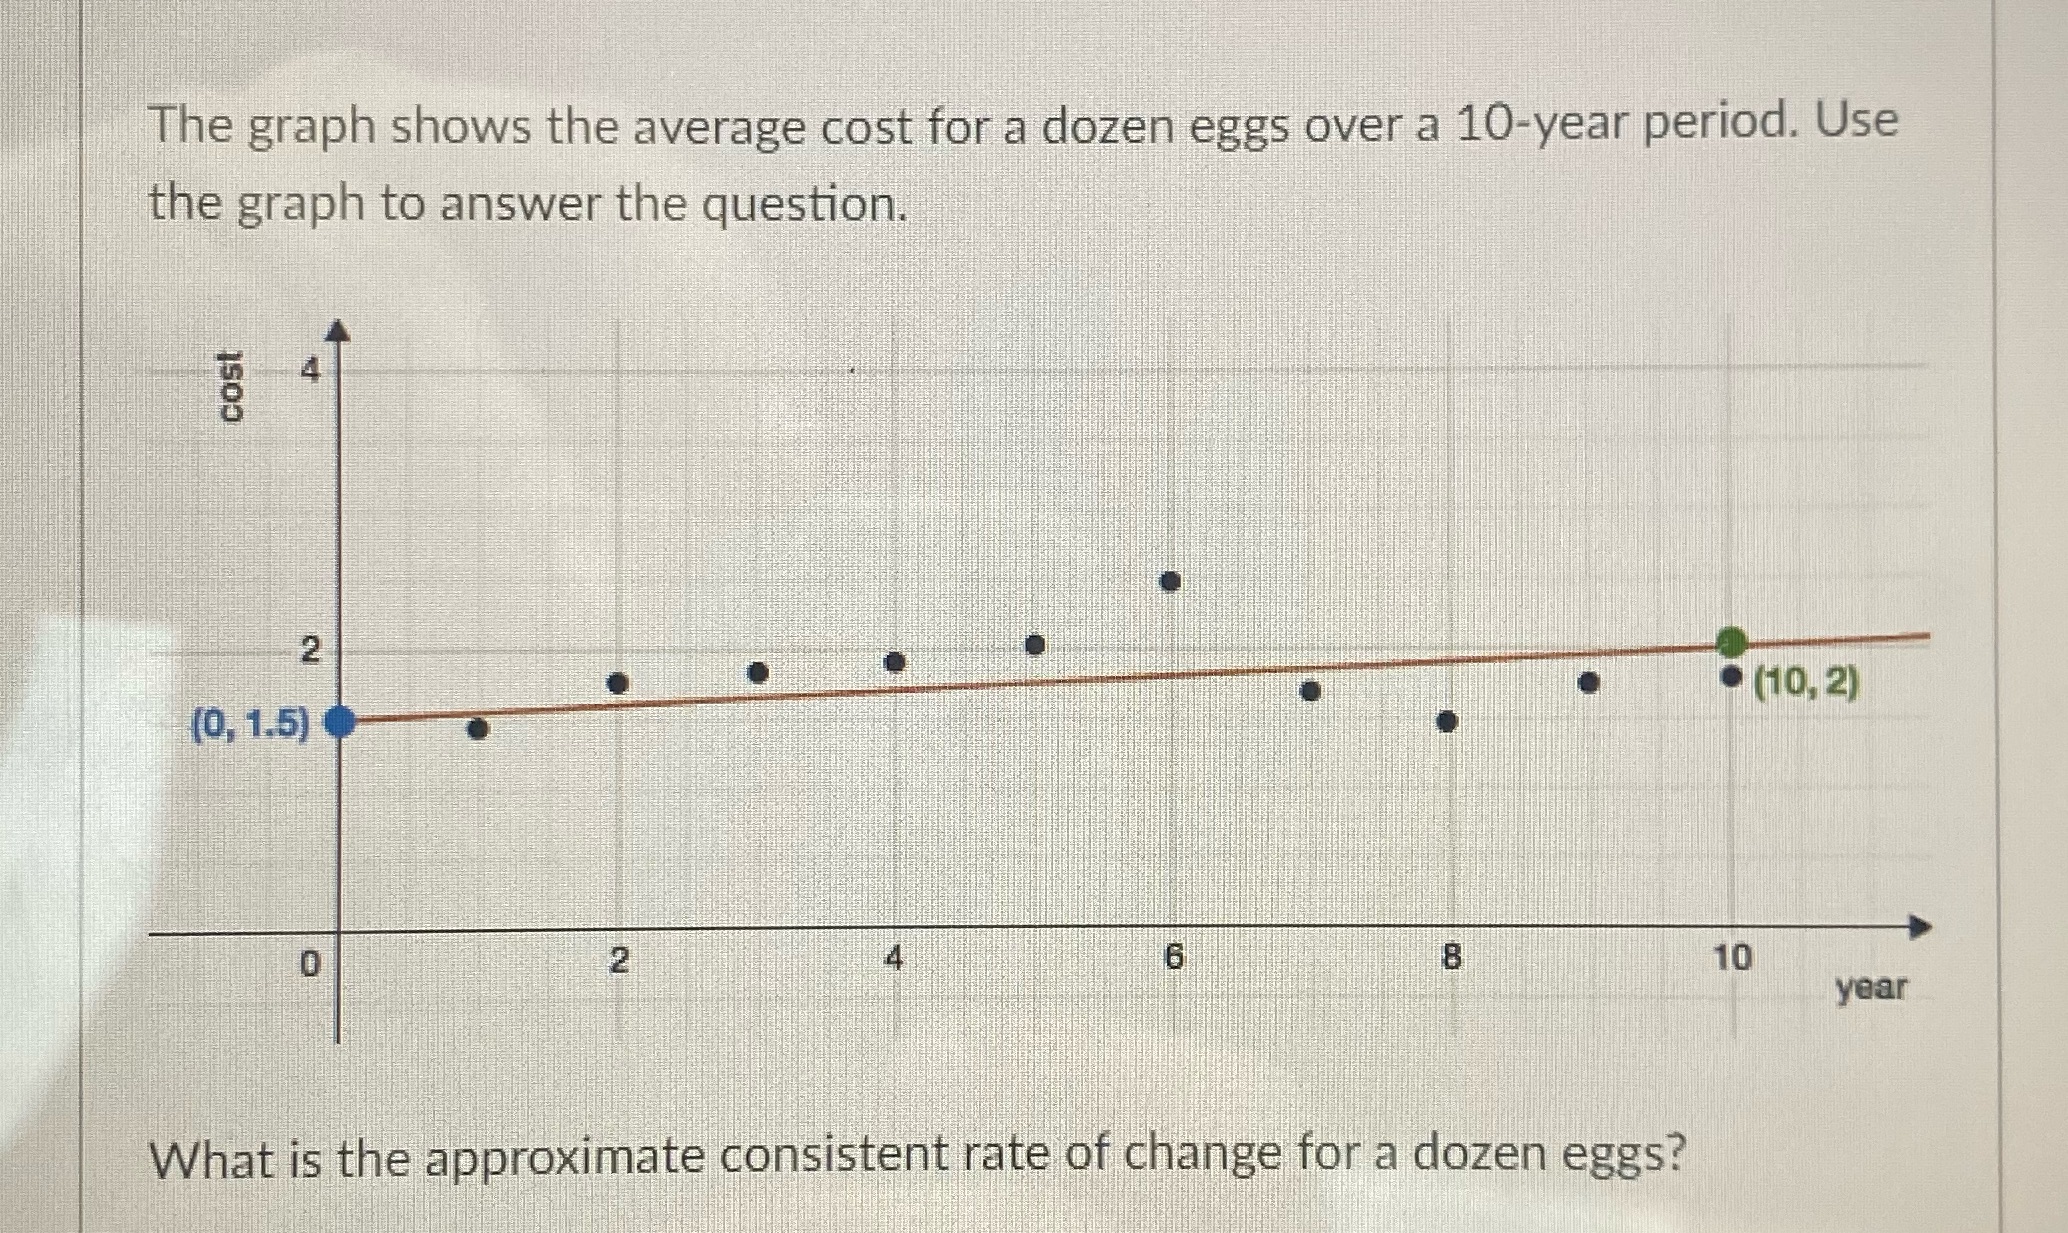
The graph shows the average cost for a dozen eggs over a 10-year period. Use the graph to answer the question. cost 2 (0, 1.5) (10, 2) 0 2 6 8 10 year What is the approximate consistent rate of change for a dozen eggs
Step by Step Solution
There are 3 Steps involved in it
1 Expert Approved Answer
Step: 1 Unlock

Question Has Been Solved by an Expert!
Get step-by-step solutions from verified subject matter experts
Step: 2 Unlock
Step: 3 Unlock