

Question: The graph shows the function g(x). (4,13) 12 10 g(x) 8 6 (3,5) 4 2 (2,1) -6 -4 -2 0 2 4 6 8
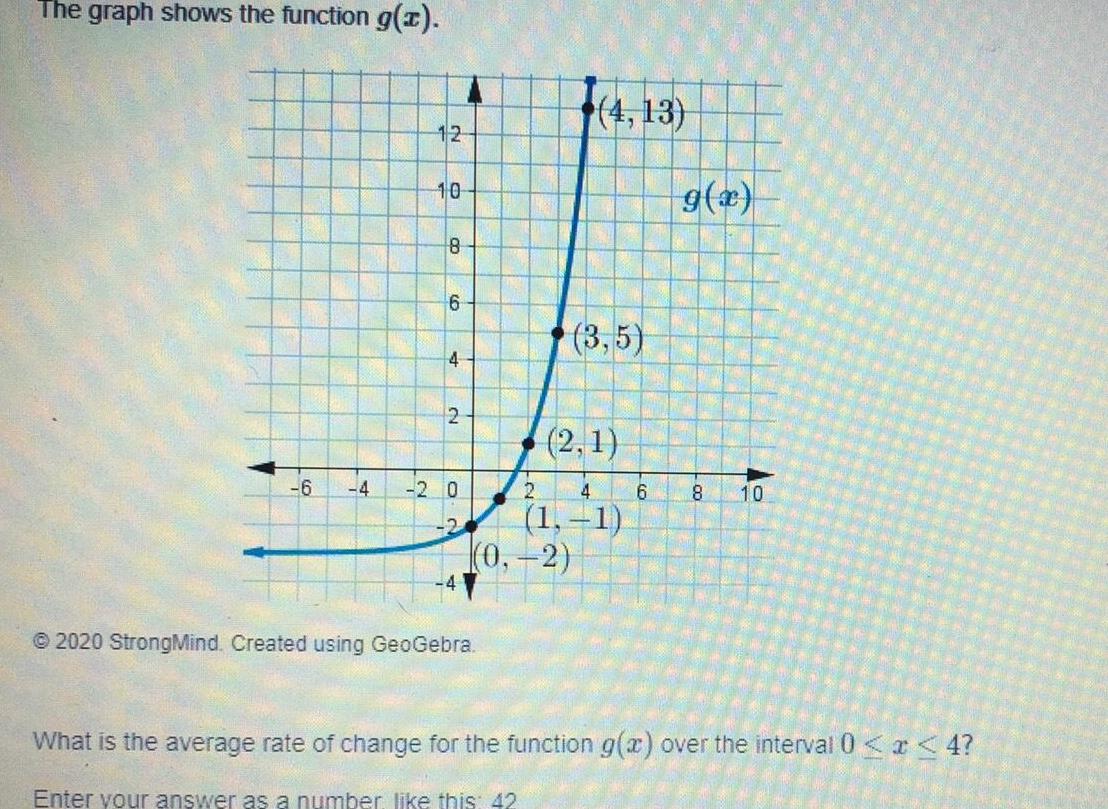
The graph shows the function g(x). (4,13) 12 10 g(x) 8 6 (3,5) 4 2 (2,1) -6 -4 -2 0 2 4 6 8 10 (1,-1) (0,-2) 2020 StrongMind. Created using GeoGebra What is the average rate of change for the function g(x) over the interval 0 < x < 4? Enter your answer as a number, like this: 42
Step by Step Solution
There are 3 Steps involved in it
1 Expert Approved Answer
Step: 1 Unlock

Question Has Been Solved by an Expert!
Get step-by-step solutions from verified subject matter experts
Step: 2 Unlock
Step: 3 Unlock